As of April 3rd, Hyperliquid (HYPE) is trading around $35.60. While the price is up 13% over the past month, it has decreased by 8% in the last week.
Although recent monthly performance appears solid despite challenging market conditions, several warning signs suggest a potential downturn. A closer look at short-term charts reveals a pattern indicating a likely price drop, and we’re seeing a disconnect between where institutional investors are putting their money and the price movement. Additionally, internal financial data shows a significant decrease in committed capital. While the current price increase might continue for a bit longer, all indicators suggest the market will likely weaken in the future.
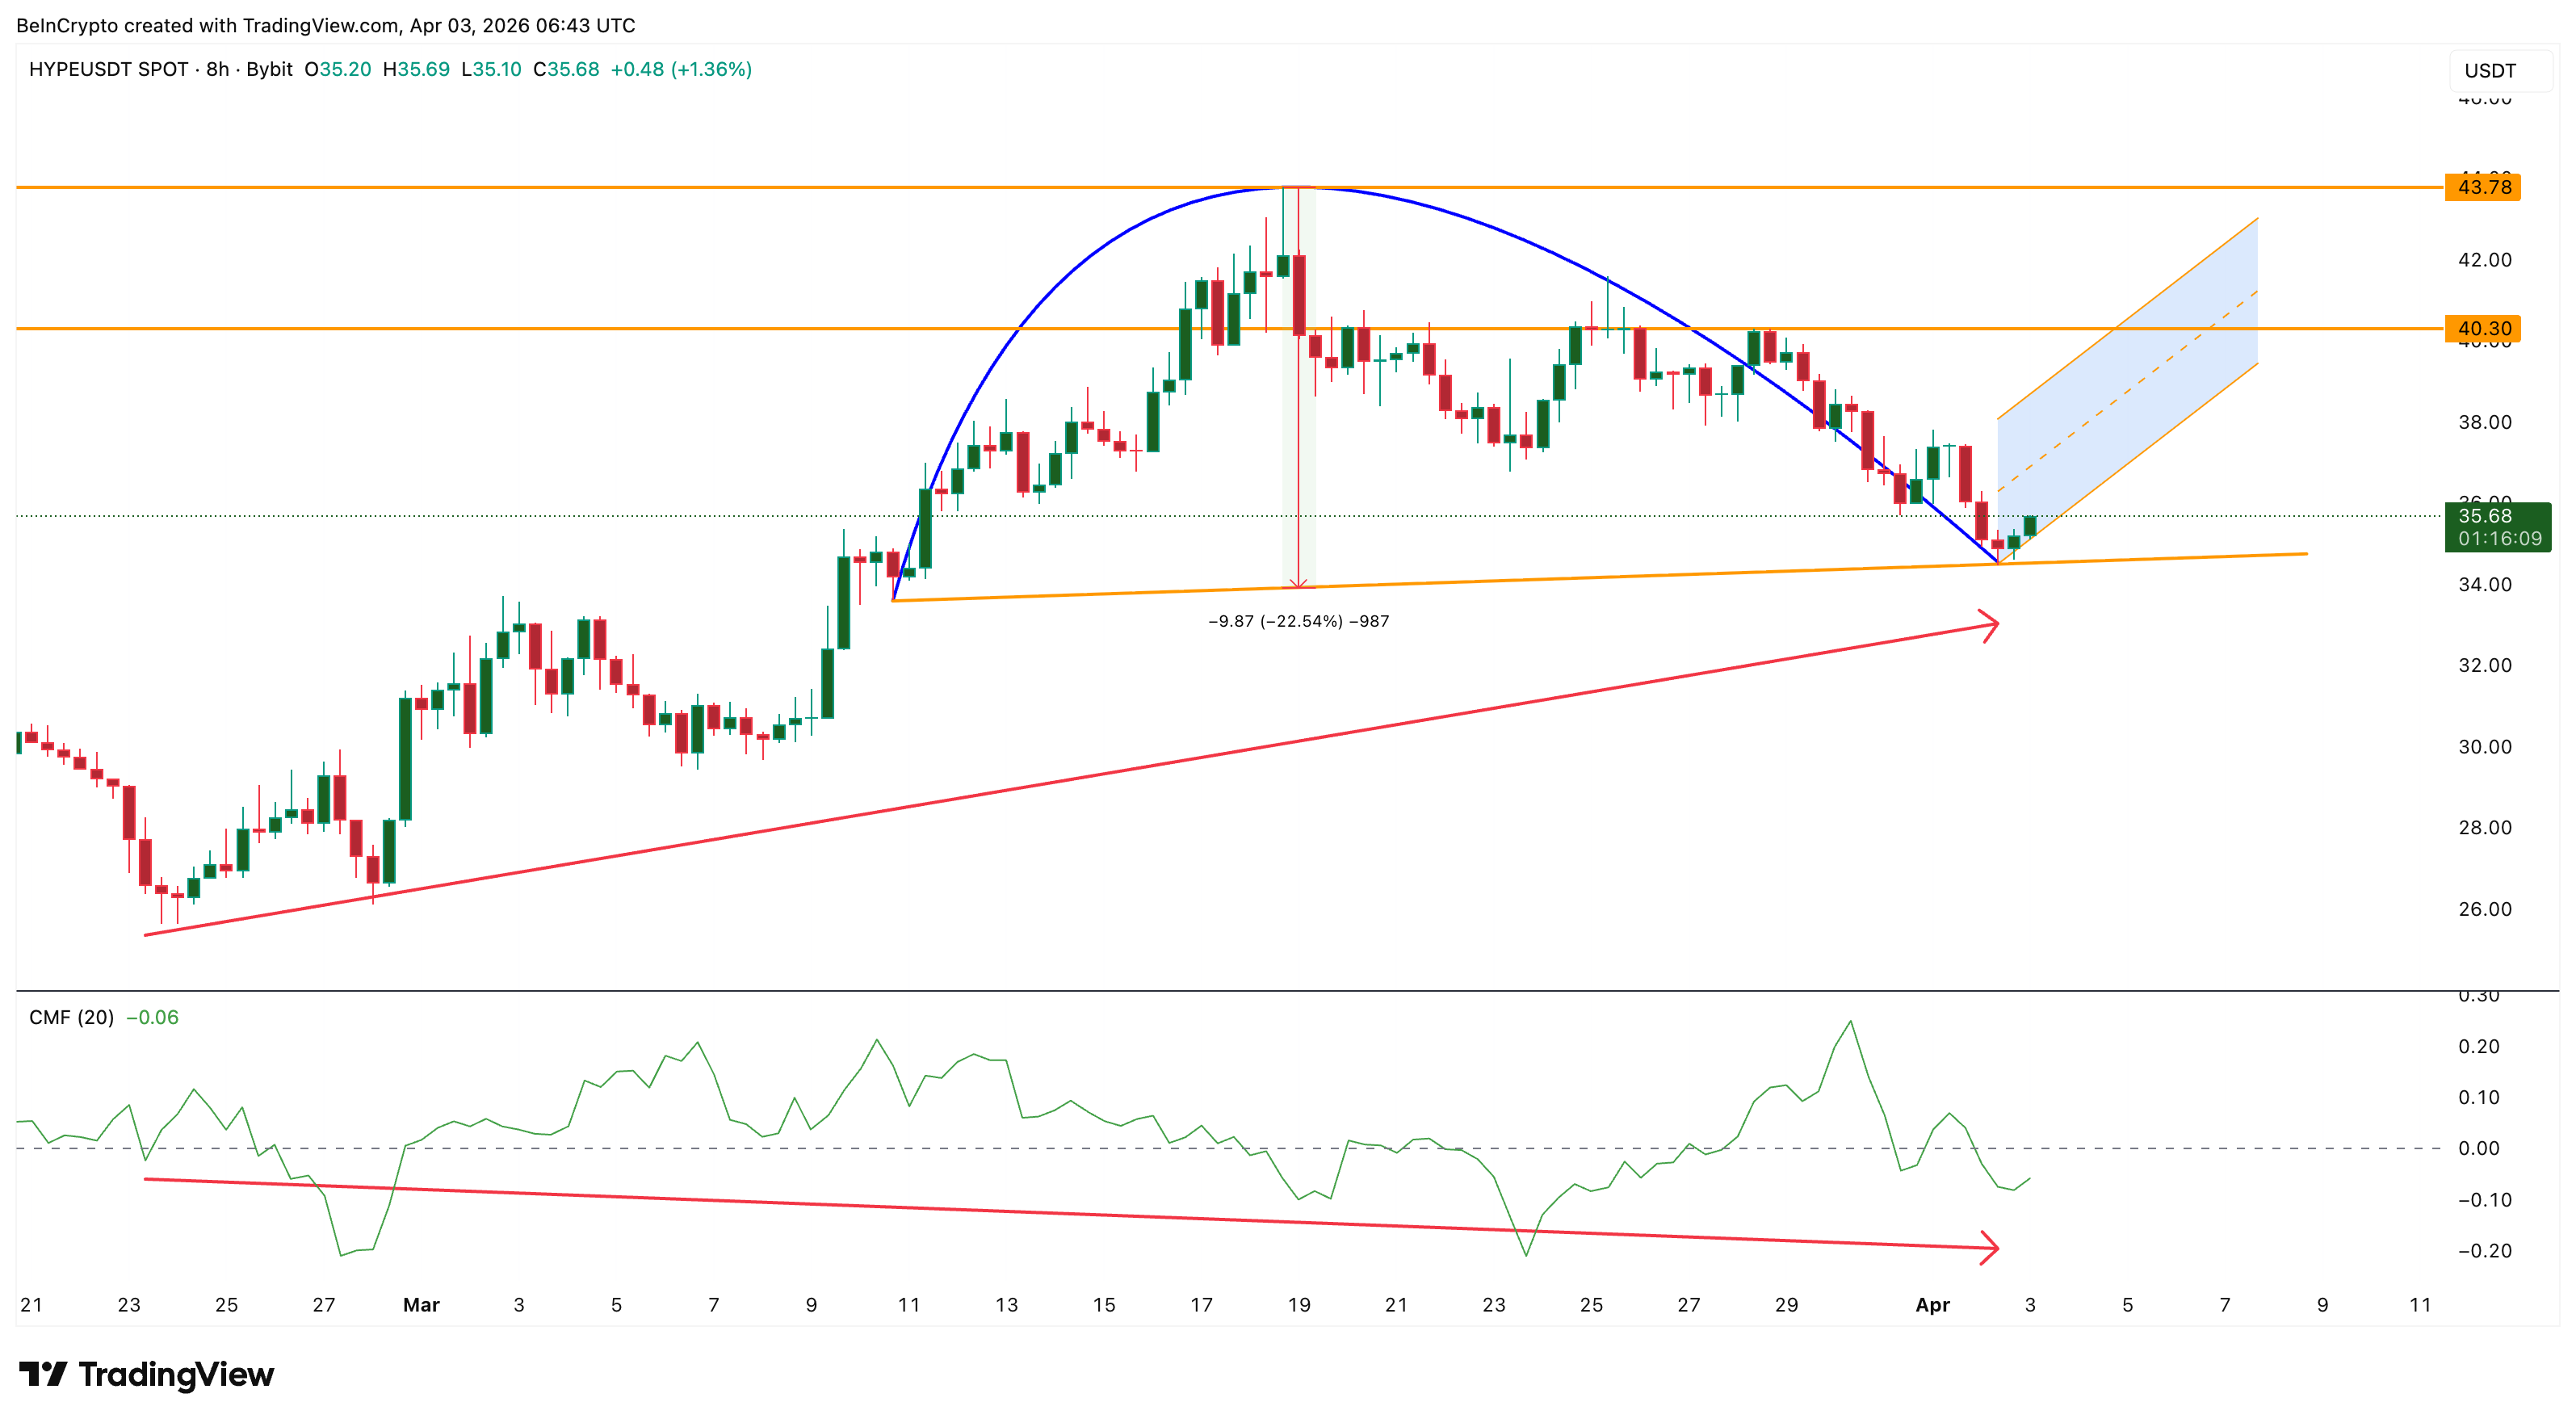
An Inverse Cup Forms as Big Money Quietly Exits
Hyperliquid’s price has been showing a concerning pattern since March 10th. Looking at an 8-hour chart, it’s forming what’s called an inverse cup and handle – a signal that the price might soon start to fall. The current slight increase in price looks like the ‘handle’ of this pattern, a small upward movement within a tightening range, and could be followed by a price drop.
The price will likely hold steady as long as HYPE remains above $40.30. If the price drops below this level, it could fall another 22% based on chart patterns.
Chaikin Money Flow (CMF) gives us a clue about what big investors are doing. It shows that even as the price of HYPE went up starting in late February, these investors were actually selling. The CMF fell into negative territory, reaching -0.06, which suggests they were decreasing their holdings during the price increase. This difference between price and CMF signals a weakening trend.
Data from Dune Analytics might explain recent changes on the Hyperliquid platform. The value of assets held on Hyperliquid, measured in USDC, reached a high of $4.02 billion around mid-September 2025. However, by March 30, 2026, this value had fallen to $1.85 billion – a decrease of 54%. Currently, more USDC is being withdrawn from the platform than deposited, as shown by the negative net flow of stablecoins.
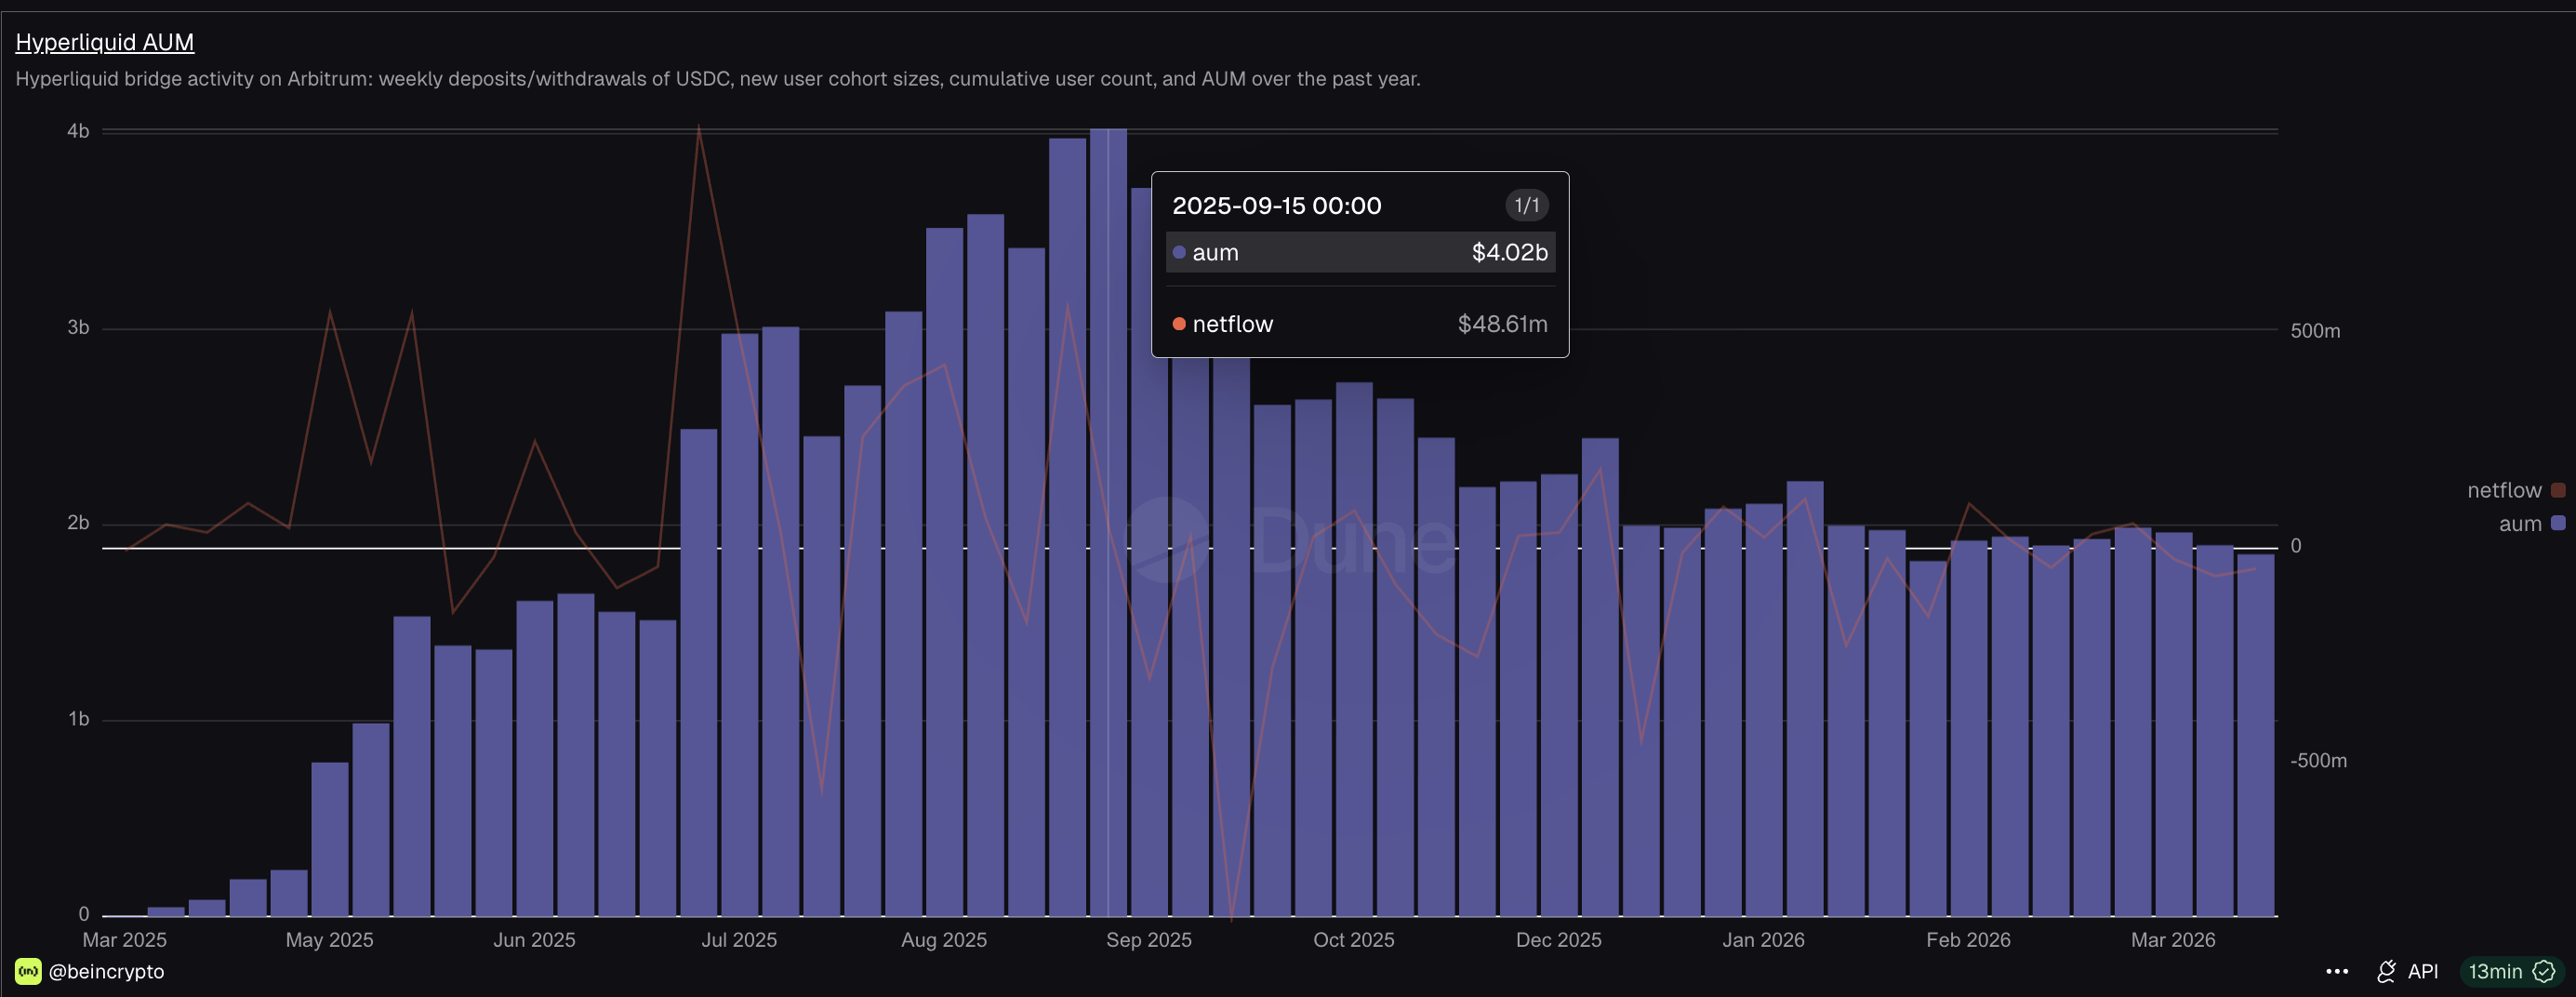
As I’ve been tracking, the decrease in Assets Under Management (AUM) seems to be part of a larger trend of shrinking capital within the DeFi space. We saw a significant drop in trading volume on decentralized exchanges (DEXs) – just $155 billion in March 2026, which is the lowest level we’ve recorded since September 2024.
Hyperliquid is a trading platform specializing in derivatives, but also offering standard spot trading. It lets traders amplify their potential profits with leverage, even with a small amount of capital in USDC.
Decentralized exchanges traded $155 billion worth of cryptocurrencies in March, which was their lowest monthly volume since September 2024.
— unfolded. (@cryptounfolded) April 1, 2026
If investment in the market decreases as prices go up, any price increase isn’t likely to last. Now, whether prices continue to rise temporarily depends on how much selling pressure there is before the current market trend comes to an end.
Liquidation Imbalance Could Fuel a Bounce Before the Break
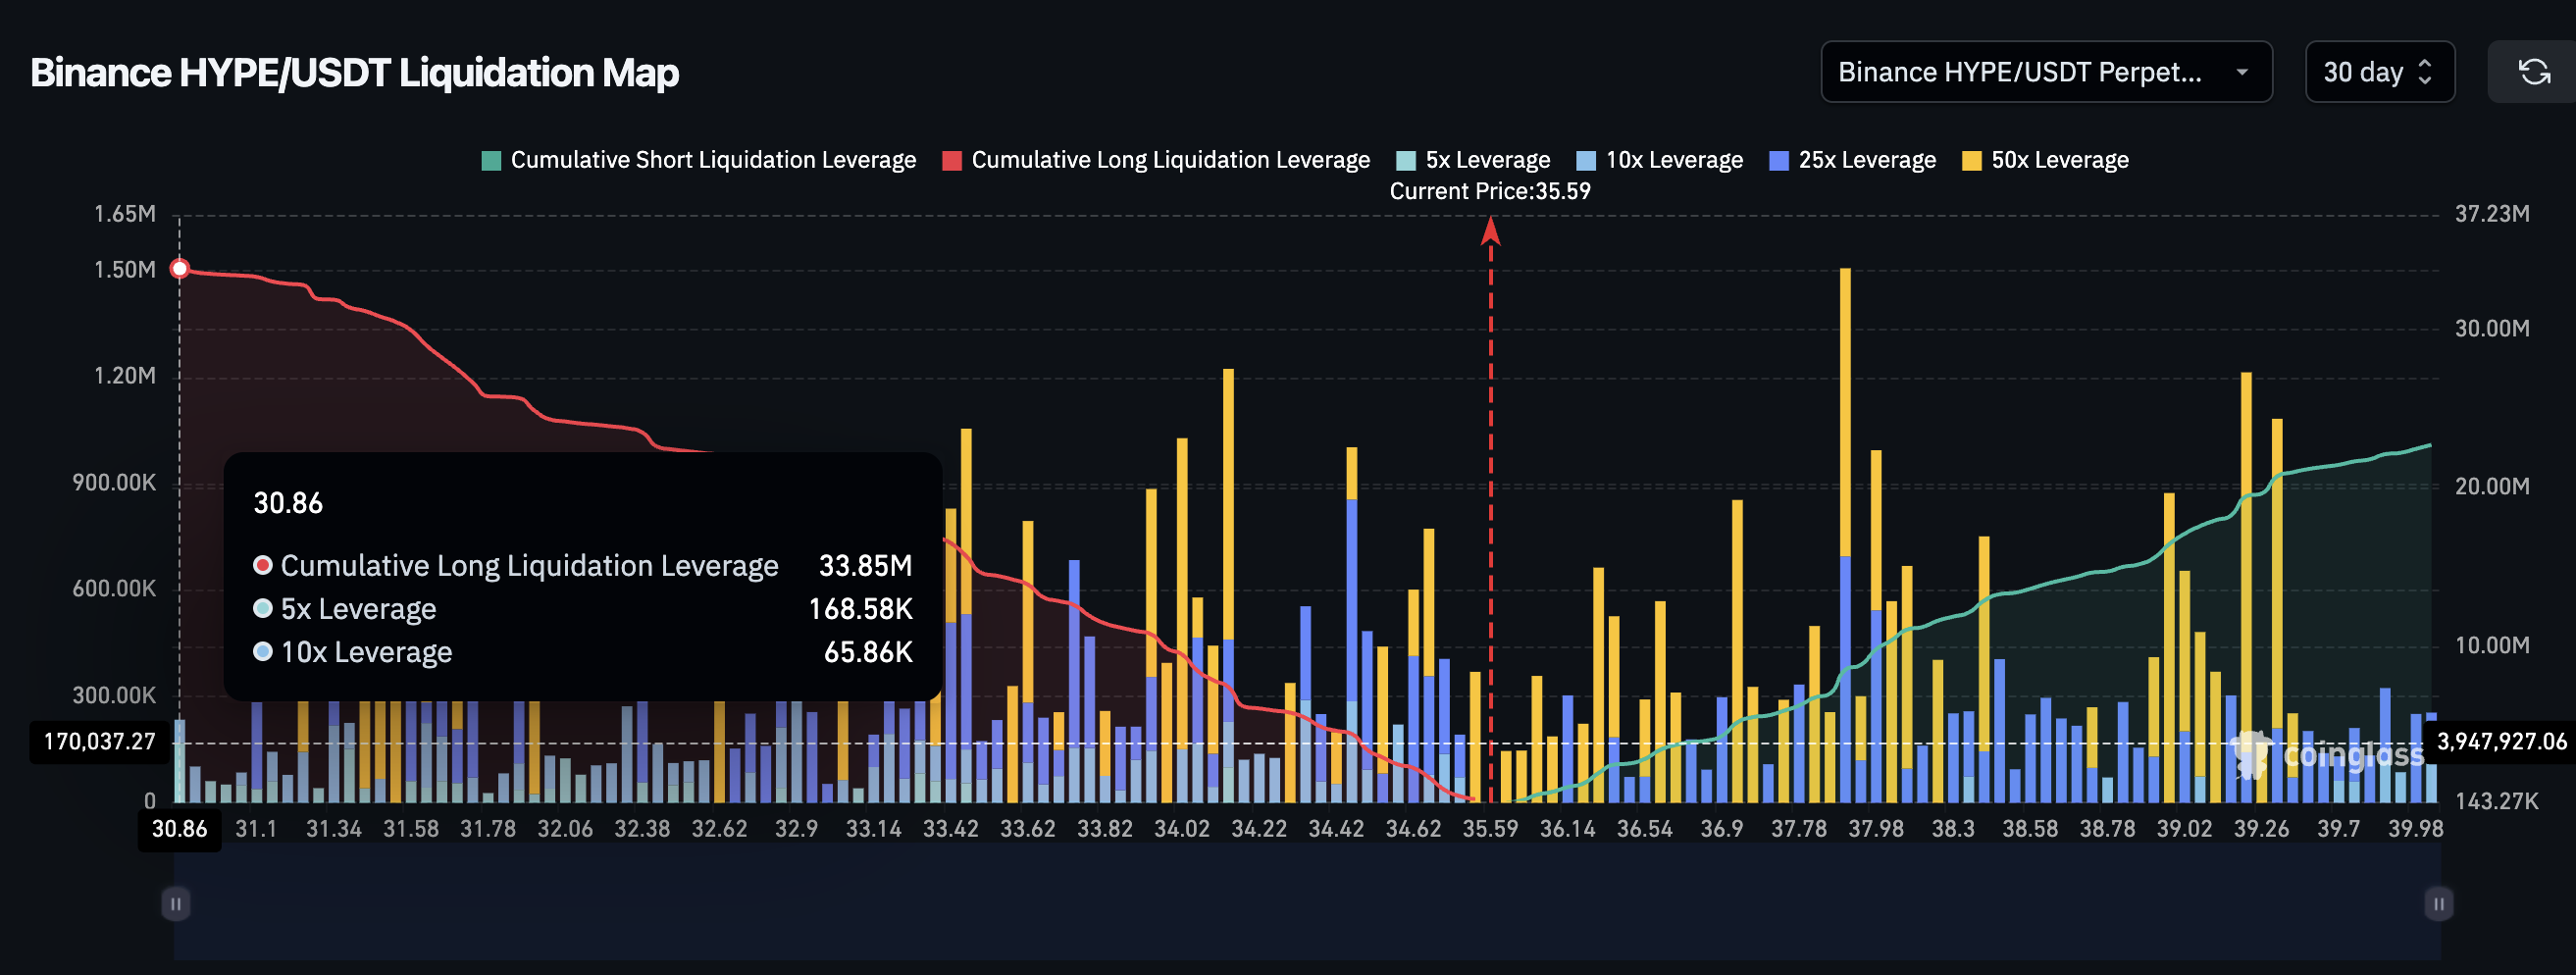
The recent activity on Binance‘s Hyperliquid market adds a new factor to consider for those predicting price drops. Over the last week, most liquidations have been of ‘short’ positions – bets that the price would fall. The total leverage used for these short positions being closed due to liquidation is $23.92 million, compared to just $7.92 million for ‘long’ positions. This significant imbalance – around 75% favoring short liquidations – suggests even a small price increase could force many shorts to close their positions, potentially causing a temporary price rise.
The recent shift in market stance over the last seven days is probably due to the fact that last week’s 8% drop already forced many existing long positions to close. Now, most of the remaining positions are new short bets anticipating further price declines.
Interested in more crypto analysis? Subscribe to Editor Harsh Notariya’s Daily Crypto Newsletter here.
Looking at the data, it seems like the market’s leaning a bit more towards bullish positions. When I check the 30-day liquidation map, I see that there’s around $33.85 million in long positions currently leveraged, compared to just $22.73 million in short positions. Basically, there’s more money at risk if the price goes up than if it goes down, at least over the last month.
Currently, traders are generally betting the price will go up, with about 30% more positions favoring increases than decreases. If the recent price increase, fueled by short-term buying, doesn’t break through important resistance levels and the price starts falling again, those longer-term bets could suffer losses. If the price drops to around $34.13, it could confirm a downward trend and cause a further sell-off as those holding long positions are forced to sell.

The liquidation data suggests the price could temporarily rise due to short squeezes, but ultimately, the market is likely to fall as leveraged positions are unwound and investment slows down.
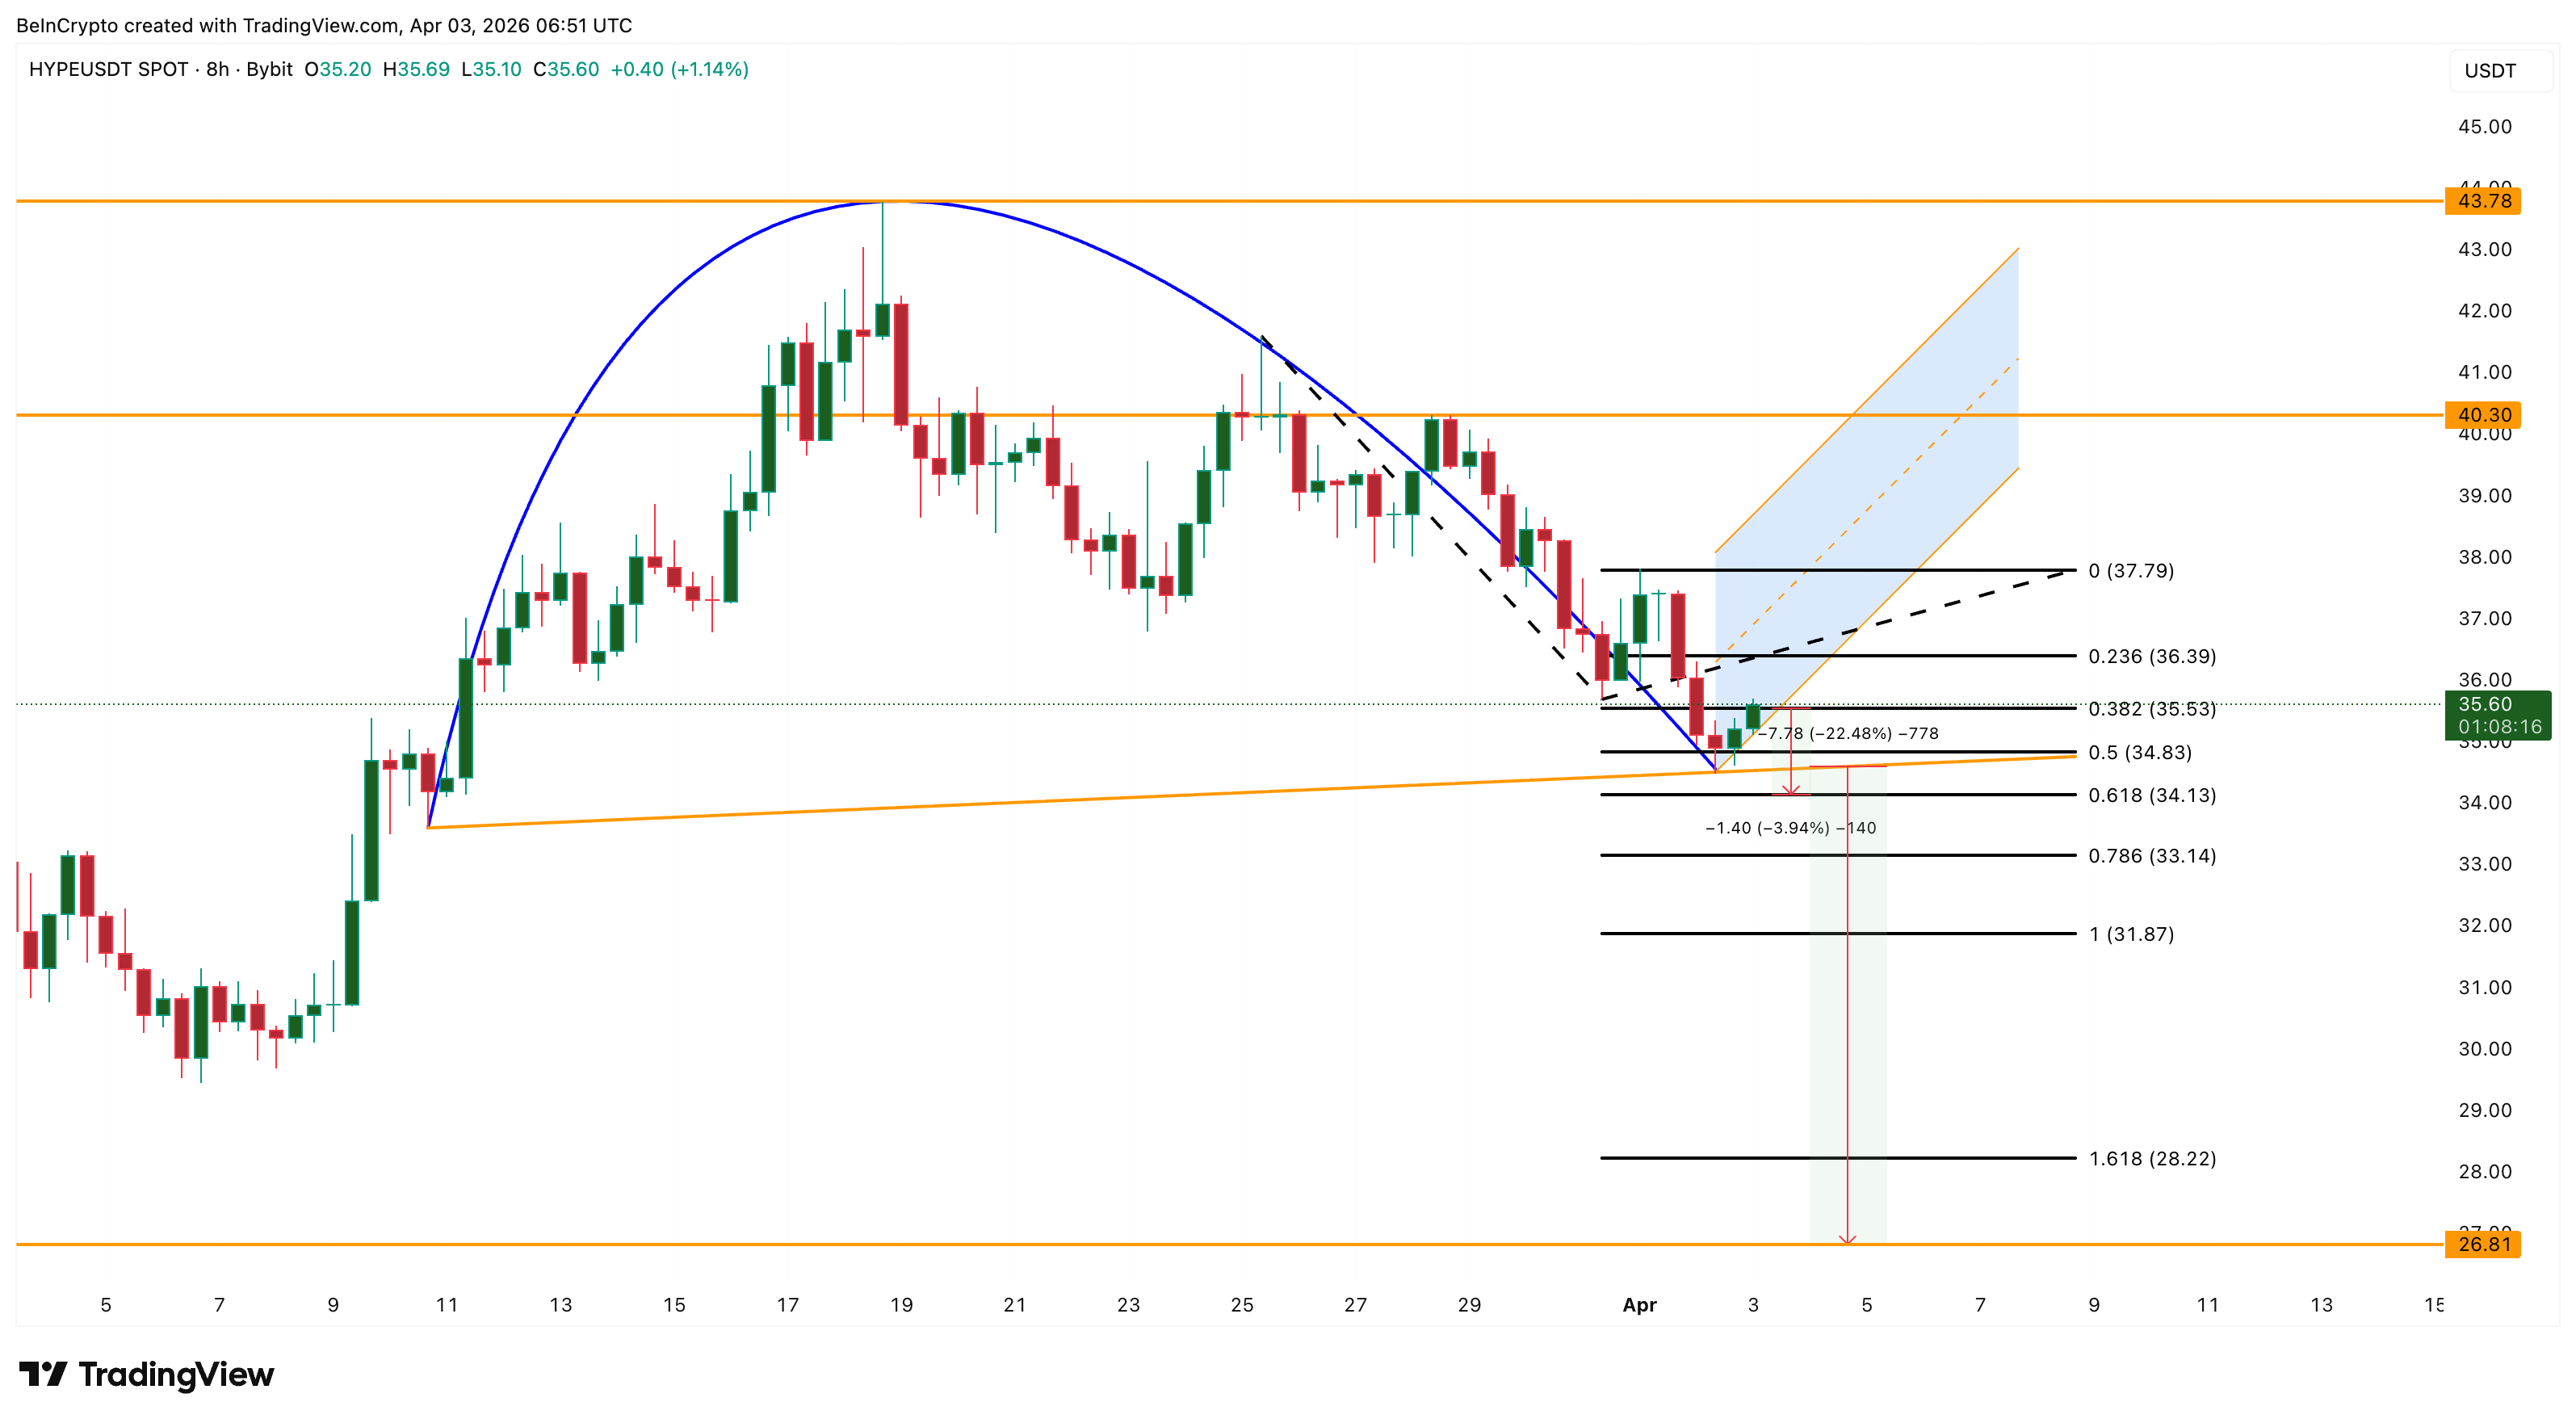
Hyperliquid Price Levels That Decide the Pattern
Looking at the 8-hour price chart with Fibonacci levels, we can see a likely path for Hyperliquid. Currently, HYPE is trading at $35.60, positioned between the $35.53 and $36.39 Fibonacci levels.
For HYPE to really start moving upwards, it needs to break through $36.39 and then $37.79. If the price goes above $40.30, it will suggest the current technical pattern isn’t reliable. Surpassing $43.78 would mean this pattern is no longer valid.
Currently, the price has a strong support level around $34.83. If the price falls below $34.13, it would confirm a key technical breakdown, potentially leading to a 22% drop and pushing the price down to around $26.81.
Between $34.13 and $26.81, interim support sits at $33.14, $31.87 and $28.22.
Inverse cup and handle patterns aren’t guaranteed to play out as expected. A sudden price increase due to short covering could temporarily push the price higher, potentially stopping the expected downward move. However, several factors – decreasing money flow, declining assets under management, negative USDC activity, and a market leaning towards long positions – suggest this price increase is probably just a temporary pause, not a complete change in direction.
If the price falls below $34.13, it suggests a brief recovery is over and a larger drop to $26.81 is likely. However, rising above $40.30 would be the first sign that the price might start to increase in the near future.
Read More
- United Airlines can now kick passengers off flights and ban them for not using headphones
- Crimson Desert: Disconnected Truth Puzzle Guide
- How to Get to the Undercoast in Esoteric Ebb
- All 9 Coalition Heroes In Invincible Season 4 & Their Powers
- All Golden Ball Locations in Yakuza Kiwami 3 & Dark Ties
- All Itzaland Animal Locations in Infinity Nikki
- Katanire’s Yae Miko Cosplay: Genshin Impact Masterpiece
- Warframe Voruna Prime access begins on April 8 for all platforms, new deluxe cosmetic Warframe skins revealed
- Zendaya’s 4 Big 2026 Movies Could Beat Brie Larson’s Box 2019 Office Record
- Dakota County’s plan to end hunger involves locking mayors in escape rooms
2026-04-03 18:21