Author: Denis Avetisyan
New research demonstrates how learned representations of bond characteristics can dramatically improve similarity searches and modeling in fixed-income markets.
Representation learning offers a significant advantage over traditional methods for bond similarity search, particularly when dealing with sparse data and categorical attributes.
Despite the prevalence of quantitative methods in fixed-income analytics, effectively capturing nuanced similarities between financial bonds remains a challenge due to the dominance of numerical attributes over crucial categorical features. This is addressed in ‘Financial Bond Similarity Search Using Representation Learning’, which proposes leveraging learned embeddings to represent categorical bond characteristics, demonstrably improving the accuracy of similarity searches and spread curve reconstruction. The core finding is that these embeddings outperform traditional one-hot encoding, particularly when dealing with sparse data-a common issue in bond markets. Could this approach unlock more robust risk modeling and ultimately, more informed investment decisions in fixed income?
Decoding the Bond Market: The Limits of Tradition
The established practice of fixed-income analysis is notably constrained by its dependence on painstakingly assembled data and the subjective evaluations of market experts. This reliance creates significant bottlenecks in processing information and responding to rapidly changing market conditions. Manual data curation is inherently time-consuming and susceptible to human error, while the interpretation of bond characteristics often hinges on qualitative assessments that lack standardization. Consequently, this approach is not only slow and expensive, demanding substantial investment in personnel and resources, but also limits the scalability of fixed-income strategies and hinders the ability to efficiently analyze large datasets – a growing necessity in modern finance. The cost associated with this traditional workflow presents a barrier to entry for smaller investment firms and restricts the responsiveness of even well-established institutions.
Conventional yield curve estimation, a cornerstone of fixed-income analysis, frequently encounters difficulties when applied to bonds from issuers with sparse data catalogs. These issuers, often smaller entities or those new to the market, lack the extensive historical pricing and issuance information typically used to construct reliable yield curves. This data scarcity forces analysts to rely on extrapolations from more liquid, well-documented issuers, introducing significant error and potentially mispricing risk. The resulting curves may not accurately reflect the true underlying risk profiles of these bonds, leading to flawed investment decisions and inaccurate assessments of market liquidity. Researchers are actively exploring alternative methods, including machine learning techniques and the incorporation of qualitative data, to mitigate the challenges posed by these sparse issuer catalogs and improve the accuracy of yield curve estimations for a broader range of fixed-income instruments.
Effective fixed-income risk assessment hinges on discerning nuanced distinctions in bond characteristics, a process frequently hampered by data limitations. Conventional methodologies often struggle with incomplete issuer catalogs or inconsistent reporting, obscuring critical factors like call provisions, credit ratings changes, or embedded options. These subtle features can dramatically impact a bond’s price sensitivity to interest rate fluctuations and its overall risk profile; therefore, ignoring them introduces significant model error. Recent advancements in machine learning and natural language processing are being explored to extract meaningful signals from unstructured data sources – such as prospectuses and news articles – to enrich sparse datasets and improve the accuracy of risk estimations, even when facing informational gaps.
Unveiling Hidden Patterns: Representation Learning for Bonds
Representation learning automates feature extraction from bond data, addressing the scalability and subjectivity inherent in traditional, manual analysis. Manual feature engineering requires domain expertise to identify relevant characteristics and often struggles with high-dimensional or complex datasets. Representation learning algorithms, conversely, learn these features directly from the data, identifying patterns and relationships without explicit programming. This approach is particularly beneficial when dealing with large bond datasets where manual analysis is impractical, and can uncover subtle but significant features that might be overlooked by human analysts. The resulting learned representations can then be used as input for downstream tasks such as bond pricing, risk assessment, and portfolio optimization, improving model performance and reducing reliance on manually defined features.
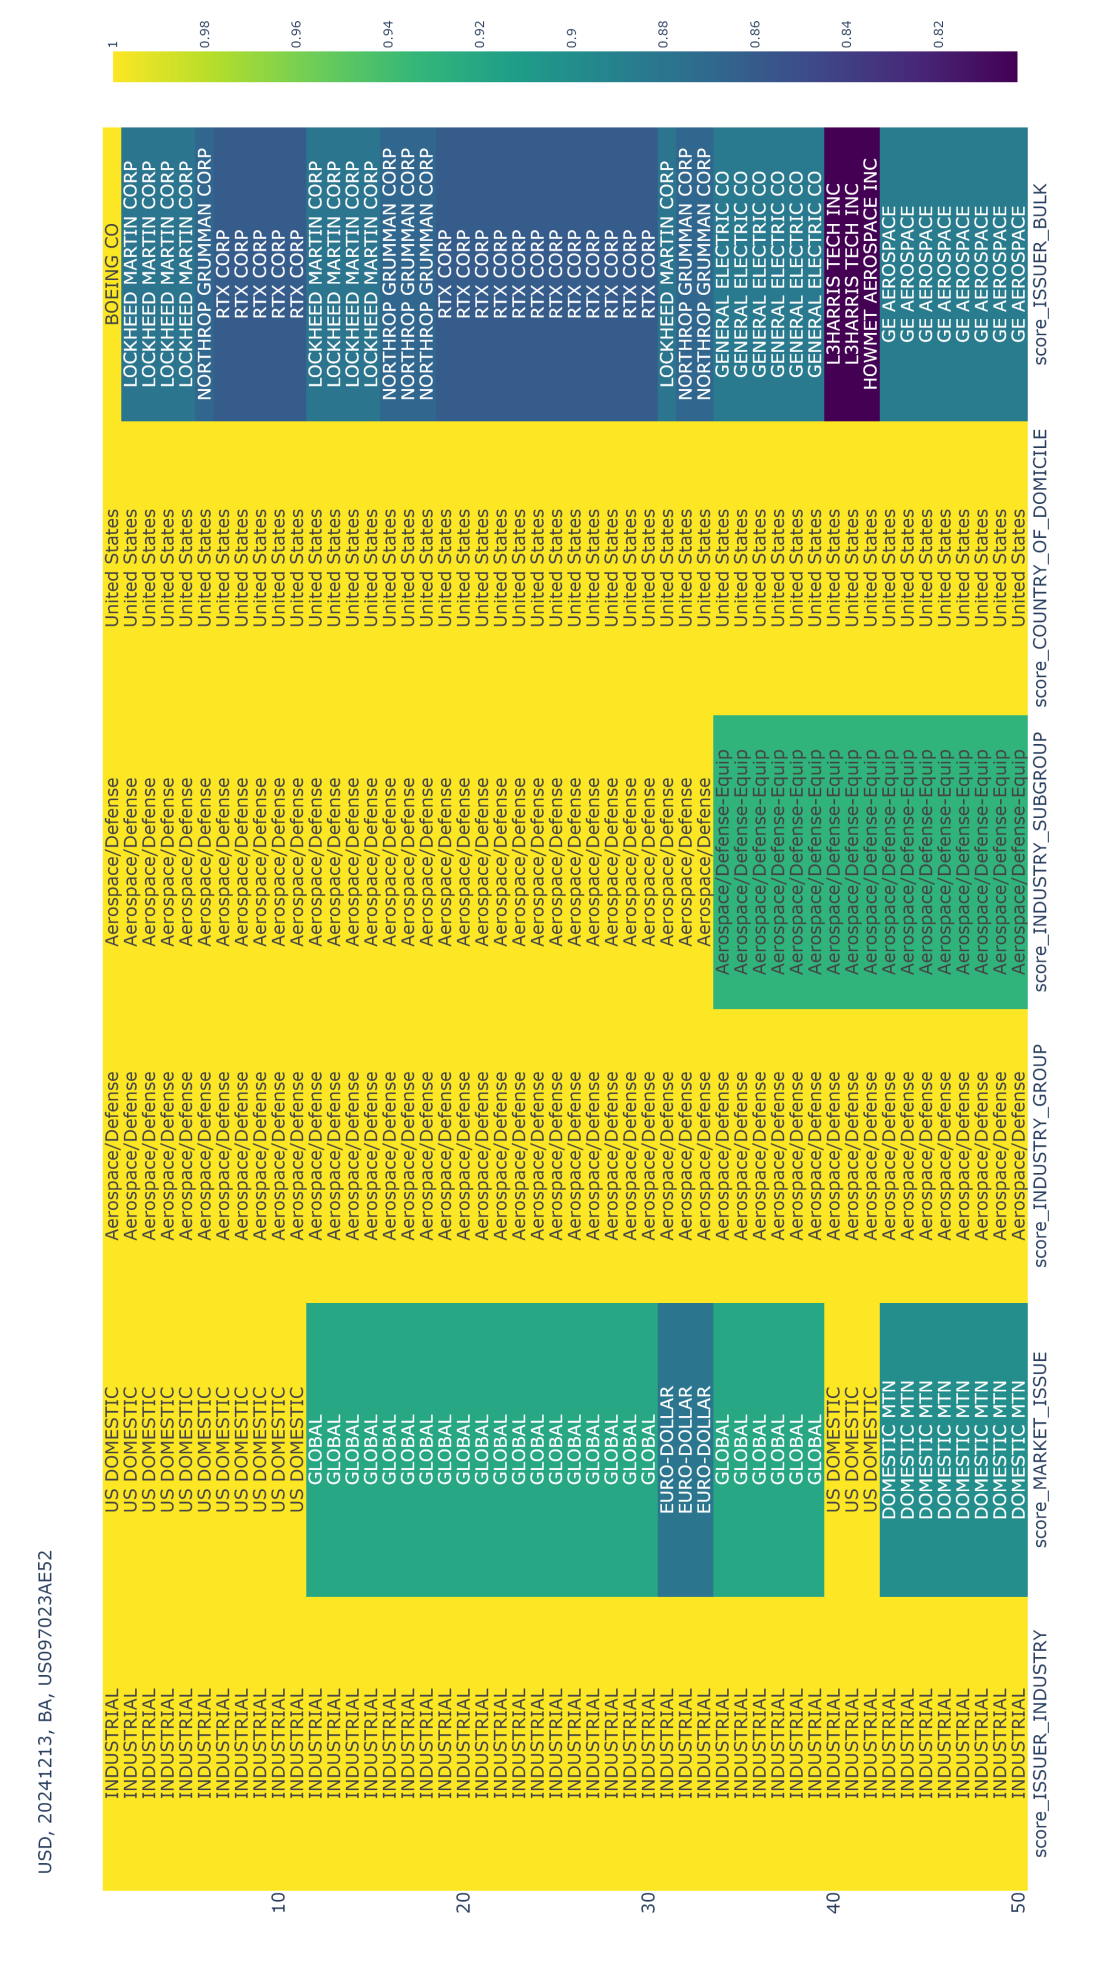
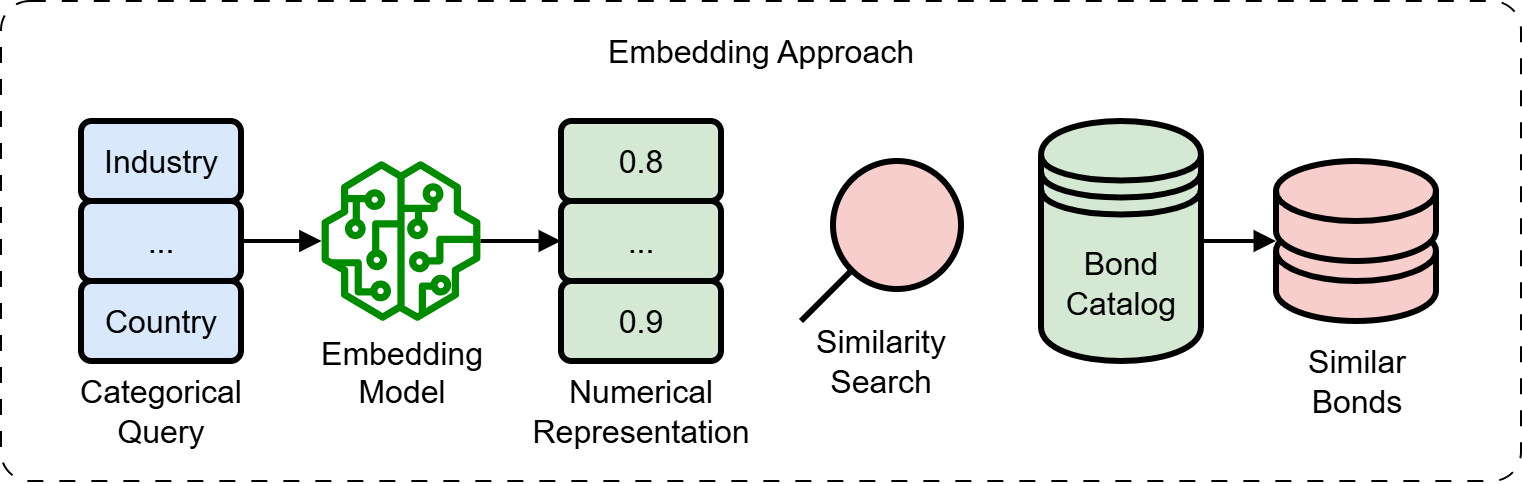
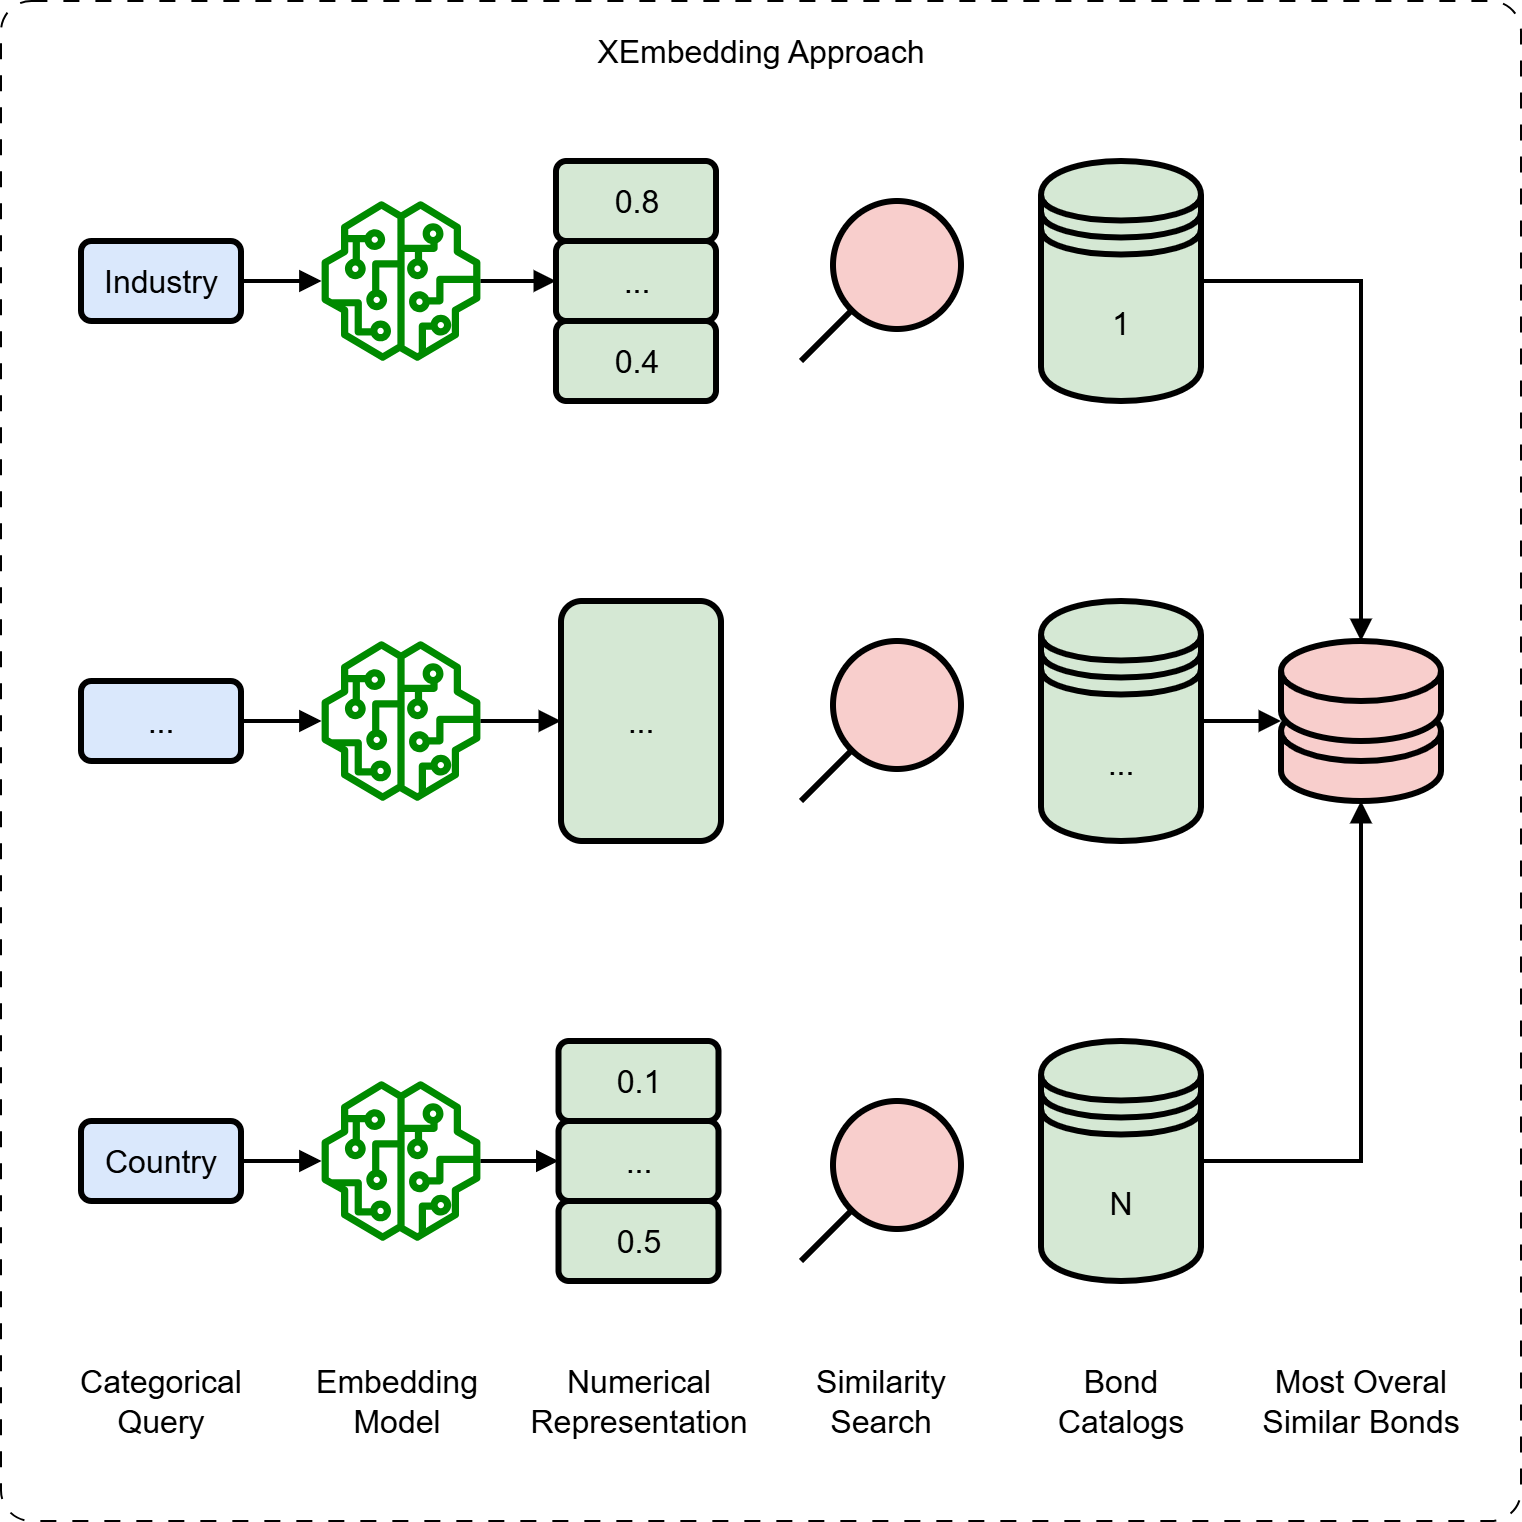
Embedding models utilize machine learning techniques to transform discrete bond characteristics, including those from high-cardinality categorical variables such as bond names or issuer details, into dense vectors within a continuous vector space. This process, often achieved through neural networks, assigns each unique category or characteristic a specific coordinate in the vector space, capturing relationships based on co-occurrence or learned patterns from the training data. The resulting vector representation allows for numerical comparisons and calculations – unlike the direct comparison of categorical strings – and facilitates the identification of bonds with similar characteristics based on their proximity in the embedded space.
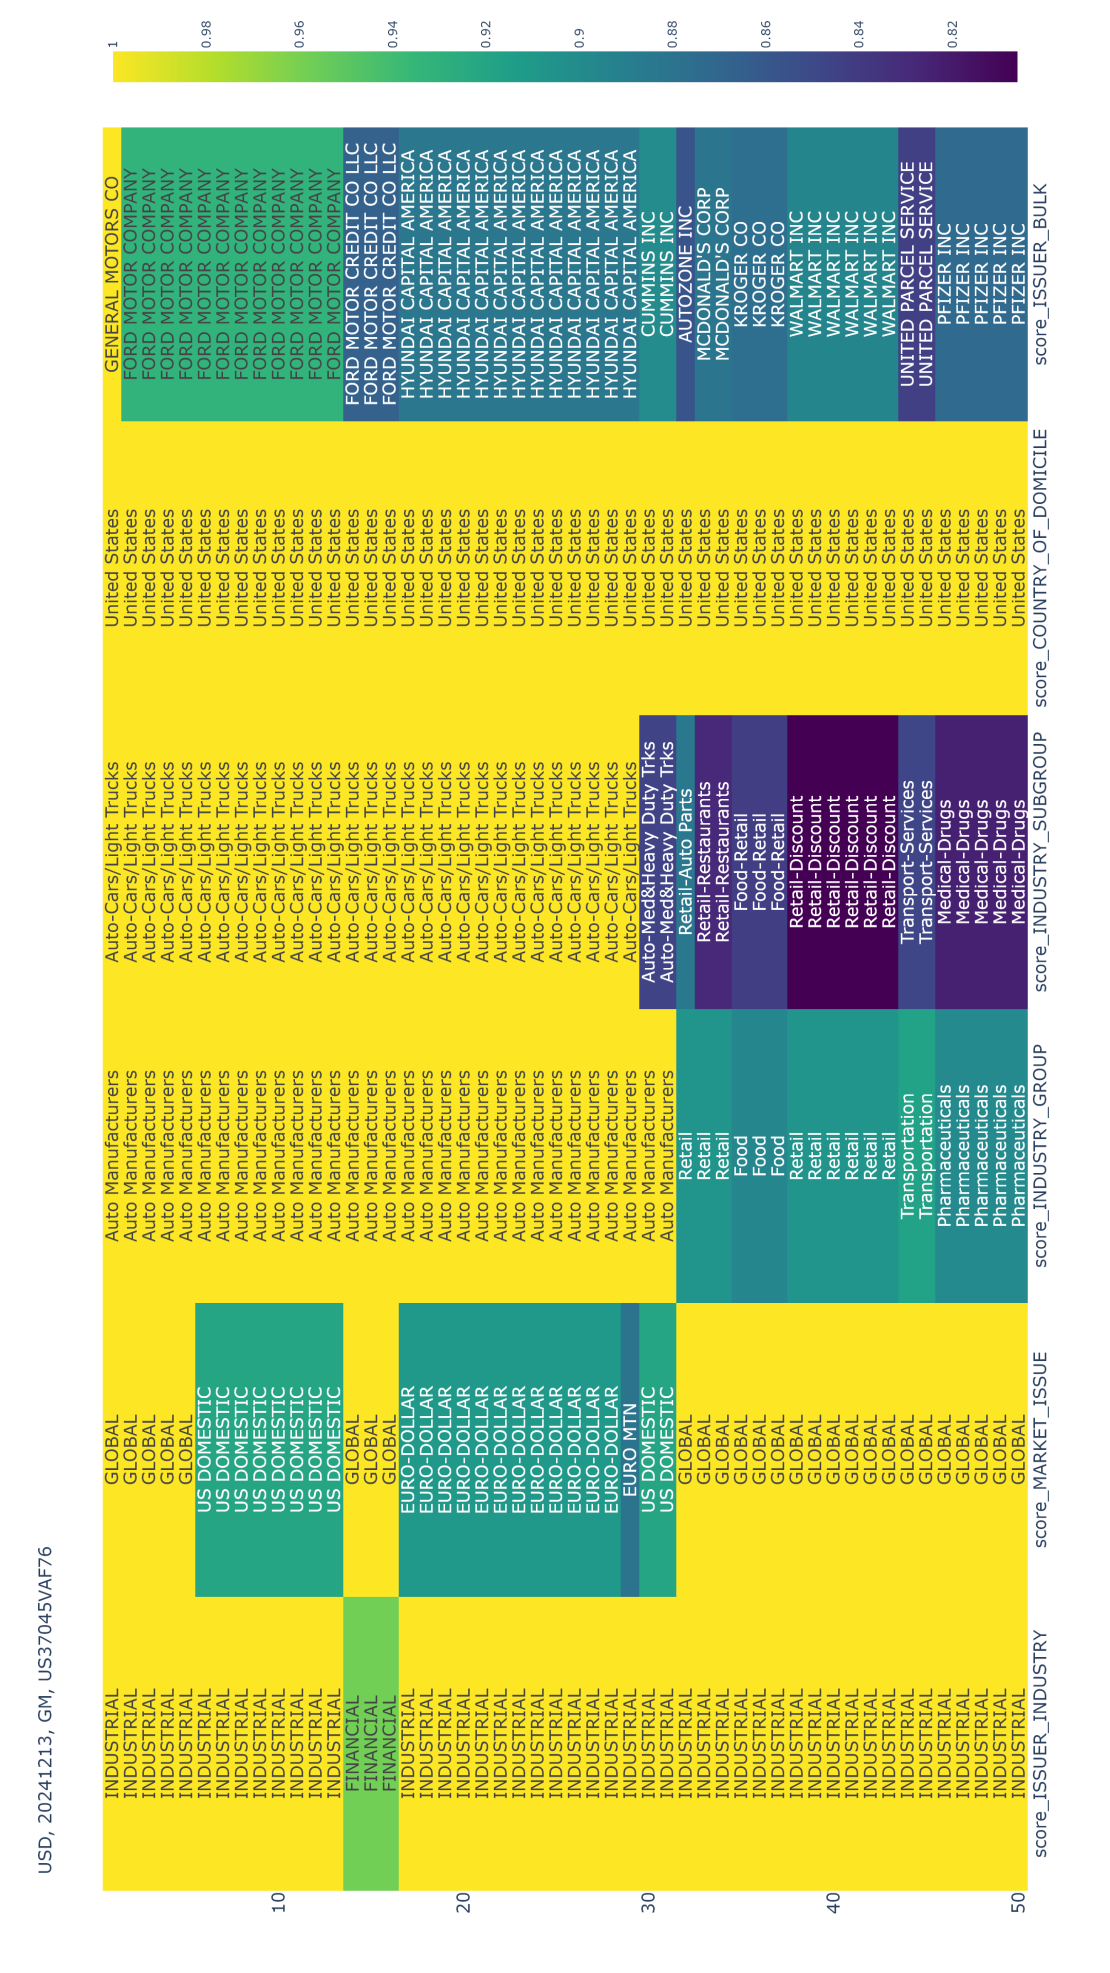
Following the creation of bond embeddings, cosine similarity provides a quantifiable metric for determining the relatedness of different bonds. Cosine similarity calculates the cosine of the angle between two embedding vectors; a value of 1 indicates perfect similarity, 0 indicates orthogonality (no similarity), and -1 indicates complete dissimilarity. This allows for the identification of bonds with similar characteristics based on their vector proximity in the embedding space, enabling tasks such as bond clustering, anomaly detection, and the identification of bonds with comparable risk profiles. The resulting similarity scores are readily comparable across the entire bond dataset, providing a standardized measure of bond relatedness derived directly from the learned representations.
Beyond Comparison: Harnessing Similarity Search in Bond Analysis
Similarity search within bond analysis leverages algorithms to identify bonds exhibiting comparable characteristics – such as credit rating, maturity date, coupon rate, and industry sector – even when complete datasets are unavailable. This functionality is achieved by representing bonds as vectors in a multi-dimensional space and calculating the distance between them; bonds with smaller distances are considered more similar. The ability to find comparable bonds despite data gaps is critical for accurate risk assessment, as it allows analysts to infer missing information based on the characteristics of similar, fully-documented bonds and provides a more robust valuation, particularly for less frequently traded or newly issued instruments.
Distance Metric Learning (DML) is a supervised machine learning technique used to optimize the embedding space of bond data. Traditional embedding methods often utilize generic distance measures that fail to capture the nuanced relationships specific to bond characteristics. DML algorithms learn a distance function – a mapping that quantifies the similarity between bonds – by analyzing labeled data where bonds are explicitly categorized as similar or dissimilar. This process adjusts the embedding space such that bonds deemed similar are positioned closer together, and dissimilar bonds are further apart, based on relevant features like credit rating, maturity date, and coupon rate. The resulting optimized embedding space allows for more accurate similarity searches and improved performance in downstream tasks such as risk assessment and portfolio analysis by focusing on the meaningful distinctions between bonds.
Implementation of similarity search techniques for bond analysis significantly enhances information retrieval by moving beyond exact keyword matches to identify bonds based on shared characteristics and relationships. This allows analysts to discover relevant bonds even with incomplete or varying data inputs, expanding the scope of their search beyond initially specified criteria. The resulting broadened dataset provides a more comprehensive view of the market, enabling more informed risk assessment and investment strategies. Specifically, the ability to retrieve bonds based on similarity, rather than strict equivalence, increases the recall of relevant data, reducing the risk of overlooking potentially important information and improving the overall efficiency of bond analysis workflows.
Validating the Signal: Performance and Accuracy Measurements
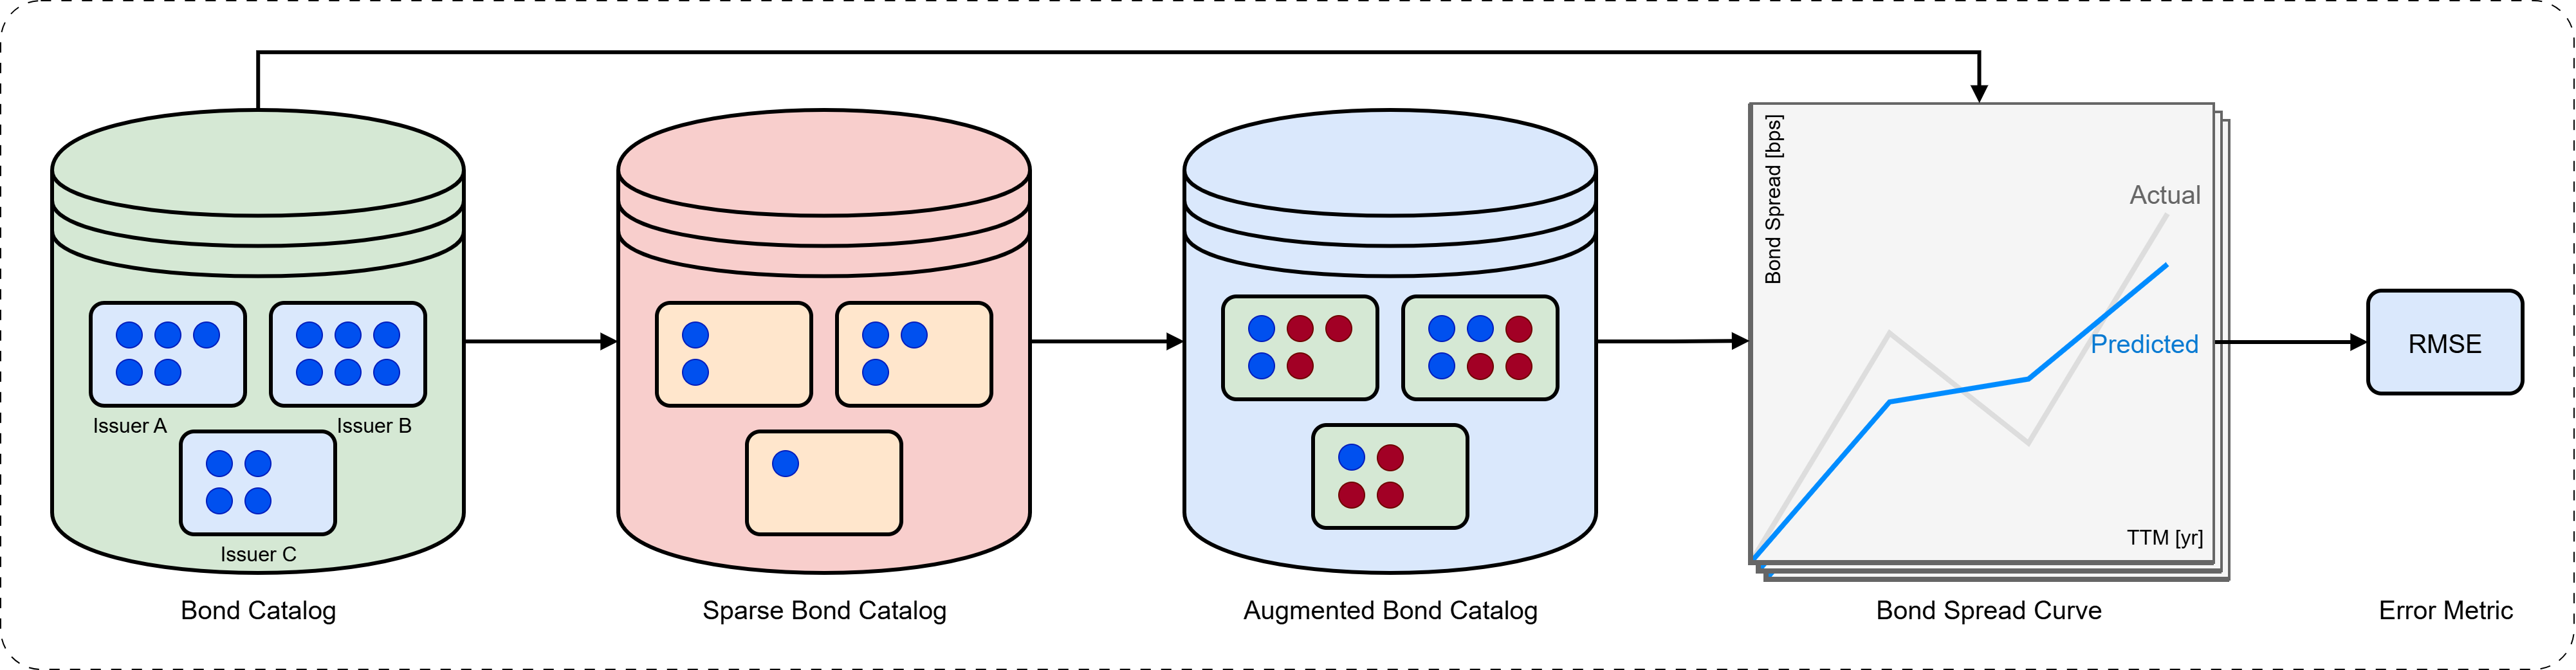
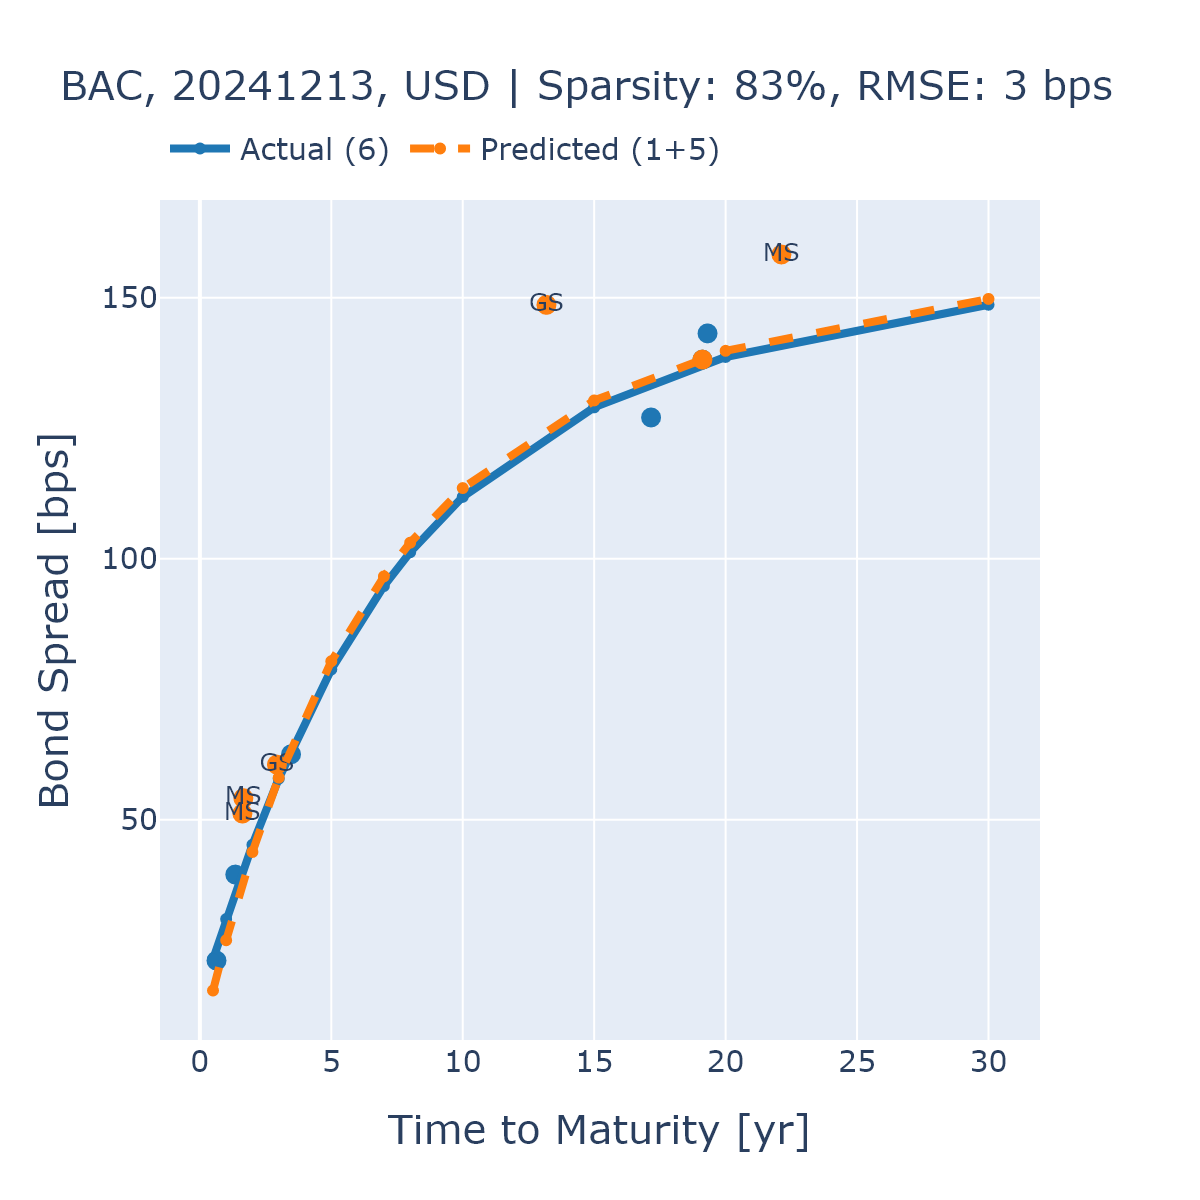
The Nelson-Siegel model, a parametric yield curve model, was utilized to validate the accuracy of our approach. This involved estimating the yield curve using our representation learning and similarity search techniques and then comparing the predicted yields to observed market values. The model’s parameters are estimated through non-linear least squares regression, minimizing the sum of squared differences between predicted and actual yields. This comparison provides a quantitative assessment of the model’s ability to capture the term structure of interest rates and serves as a benchmark for evaluating the performance of our bond analysis methodology.
Root Mean Square Error (RMSE) serves as a key performance indicator, quantifying the average magnitude of error between predicted and observed bond yields. Calculated as the square root of the mean of the squared differences between predicted and actual values, RMSE provides a statistically sound measure of predictive accuracy. In this implementation, the model achieved an overall RMSE of 18 basis points (bps), indicating a relatively small average deviation between predicted and actual yields across the tested dataset. A lower RMSE value signifies better model performance and a stronger correlation between predictions and observed market data; therefore, 18 bps demonstrates a high degree of accuracy in yield curve estimation.
Validation testing demonstrates that employing representation learning and similarity search significantly improves bond analysis accuracy, particularly with limited data. Specifically, issuers KOREA and WFC achieved a Root Mean Square Error (RMSE) of 6 basis points (bps) when analyzed using this approach. This represents a substantial improvement over the 60 bps RMSE obtained when utilizing a one-hot encoding method for the same issuers, indicating a tenfold reduction in prediction error and highlighting the efficacy of the implemented techniques for sparse datasets.
Beyond the Algorithm: The Future of AI-Driven Bond Analysis
The application of AI foundation models, particularly large language models, presents a transformative opportunity for bond analysis. These models, pre-trained on vast datasets of text and code, possess an inherent ability to discern intricate patterns and relationships often missed by traditional methods. By adapting these models to incorporate bond-specific data – including issuer financials, macroeconomic indicators, and news sentiment – analysts can unlock a deeper understanding of bond behavior and risk factors. This capability extends beyond simple prediction; foundation models can potentially identify subtle correlations, assess the impact of unforeseen events, and even generate insights into the underlying drivers of bond performance, ultimately leading to more robust and informed investment strategies.
Adaptation of contemporary AI foundation models offers a pathway to discerning subtle, non-linear connections between bond attributes and prevailing market dynamics. Traditional statistical methods often struggle with the high dimensionality and intricate interplay of factors influencing bond performance; however, these advanced models, pre-trained on vast datasets, possess an inherent capacity to identify and quantify these complex relationships. By ingesting historical bond data, macroeconomic indicators, and even unstructured data like news sentiment, the models refine their understanding, ultimately boosting the precision of predictive algorithms. This enhanced accuracy extends beyond simple price forecasting, enabling more nuanced assessments of credit risk, duration sensitivity, and potential arbitrage opportunities, thereby providing a substantial advantage to fixed-income investors and portfolio managers.
The advancement of automated fixed-income analysis signifies a paradigm shift in investment strategy. Historically reliant on manual processes and human expertise, bond analysis is becoming increasingly data-driven and efficient through algorithmic implementation. This optimization isn’t merely about speed; it facilitates the processing of larger, more complex datasets, uncovering subtle correlations previously obscured by the limitations of traditional methods. Consequently, investment professionals gain access to more nuanced insights, enabling them to assess risk and return with greater precision, and ultimately, construct portfolios aligned with evolving market dynamics and investor objectives. The capacity to automate these intricate processes promises not only cost savings but also a reduction in potential biases, leading to more rational and informed decision-making in the fixed-income landscape.
The pursuit of enhanced bond similarity search, as detailed in this work, echoes a fundamental principle of scientific inquiry: challenging established norms to reveal deeper truths. This research doesn’t simply accept traditional one-hot encoding as the standard; it actively probes its limitations, particularly within the context of sparse fixed-income data. This echoes Stephen Hawking’s sentiment: “Look up at the stars and not down at your feet. Be curious.” The paper’s application of representation learning to create bond embeddings-a move away from conventional methods-is precisely this kind of upward gaze. By reverse-engineering the attributes of these financial instruments into a learned space, the study unlocks improved performance in similarity calculations and spread curve reconstruction, proving that breaking the rule-in this case, the rule of simple categorical representation-can yield significant insight.
What Lies Ahead?
The demonstrated efficacy of learned embeddings for bond similarity isn’t merely a performance gain; it’s an admission. Traditional financial modeling, reliant on explicitly defined categories and one-hot encoding, implicitly assumes that the system wants to be dissected that way. This work suggests the opposite-that inherent relationships exist between categories, obscured by rigid classification. A bug, in this context, is the system confessing its design sins. The challenge now isn’t to refine the embedding space, but to understand what it reveals about the underlying structure of fixed-income markets-a structure previously invisible due to the limitations of the tools used to observe it.
The paper acknowledges the difficulty posed by sparse data, and while representation learning mitigates this, it doesn’t erase it. Future investigations should focus on active learning strategies-methods to intelligently select which bonds require more detailed analysis, maximizing information gain with minimal effort. Furthermore, the current reliance on cosine similarity, while effective, feels…convenient. Exploring alternative distance metrics, potentially learned alongside the embeddings themselves, could expose more nuanced relationships.
Ultimately, the true test won’t be improved spread curve reconstruction, but predictive power. Can these embeddings anticipate market shifts, not simply reflect them? The ability to model not just what is, but what will be, will reveal whether this is simply a clever optimization, or a genuine step towards reverse-engineering the logic of financial markets.
Original article: https://arxiv.org/pdf/2602.07020.pdf
Contact the author: https://www.linkedin.com/in/avetisyan/
See also:
- United Airlines can now kick passengers off flights and ban them for not using headphones
- Gold Rate Forecast
- All Golden Ball Locations in Yakuza Kiwami 3 & Dark Ties
- How to Solve the Glenbright Manor Puzzle in Crimson Desert
- How to Complete Bloom of Tranquility Challenge in Infinity Nikki
- 15 Lost Disney Movies That Will Never Be Released
- 8 Actors Who Could Play Blackbeard In One Piece Live-Action Season 3
- These are the 25 best PlayStation 5 games
- What are the Minecraft Far Lands & how to get there
- Wartales Curse of Rigel DLC Guide – Best Tips, POIs & More
2026-02-10 15:15