Author: Denis Avetisyan
Researchers are leveraging the power of artificial intelligence and structured knowledge to move beyond traditional stock market analysis and generate explainable investment insights.
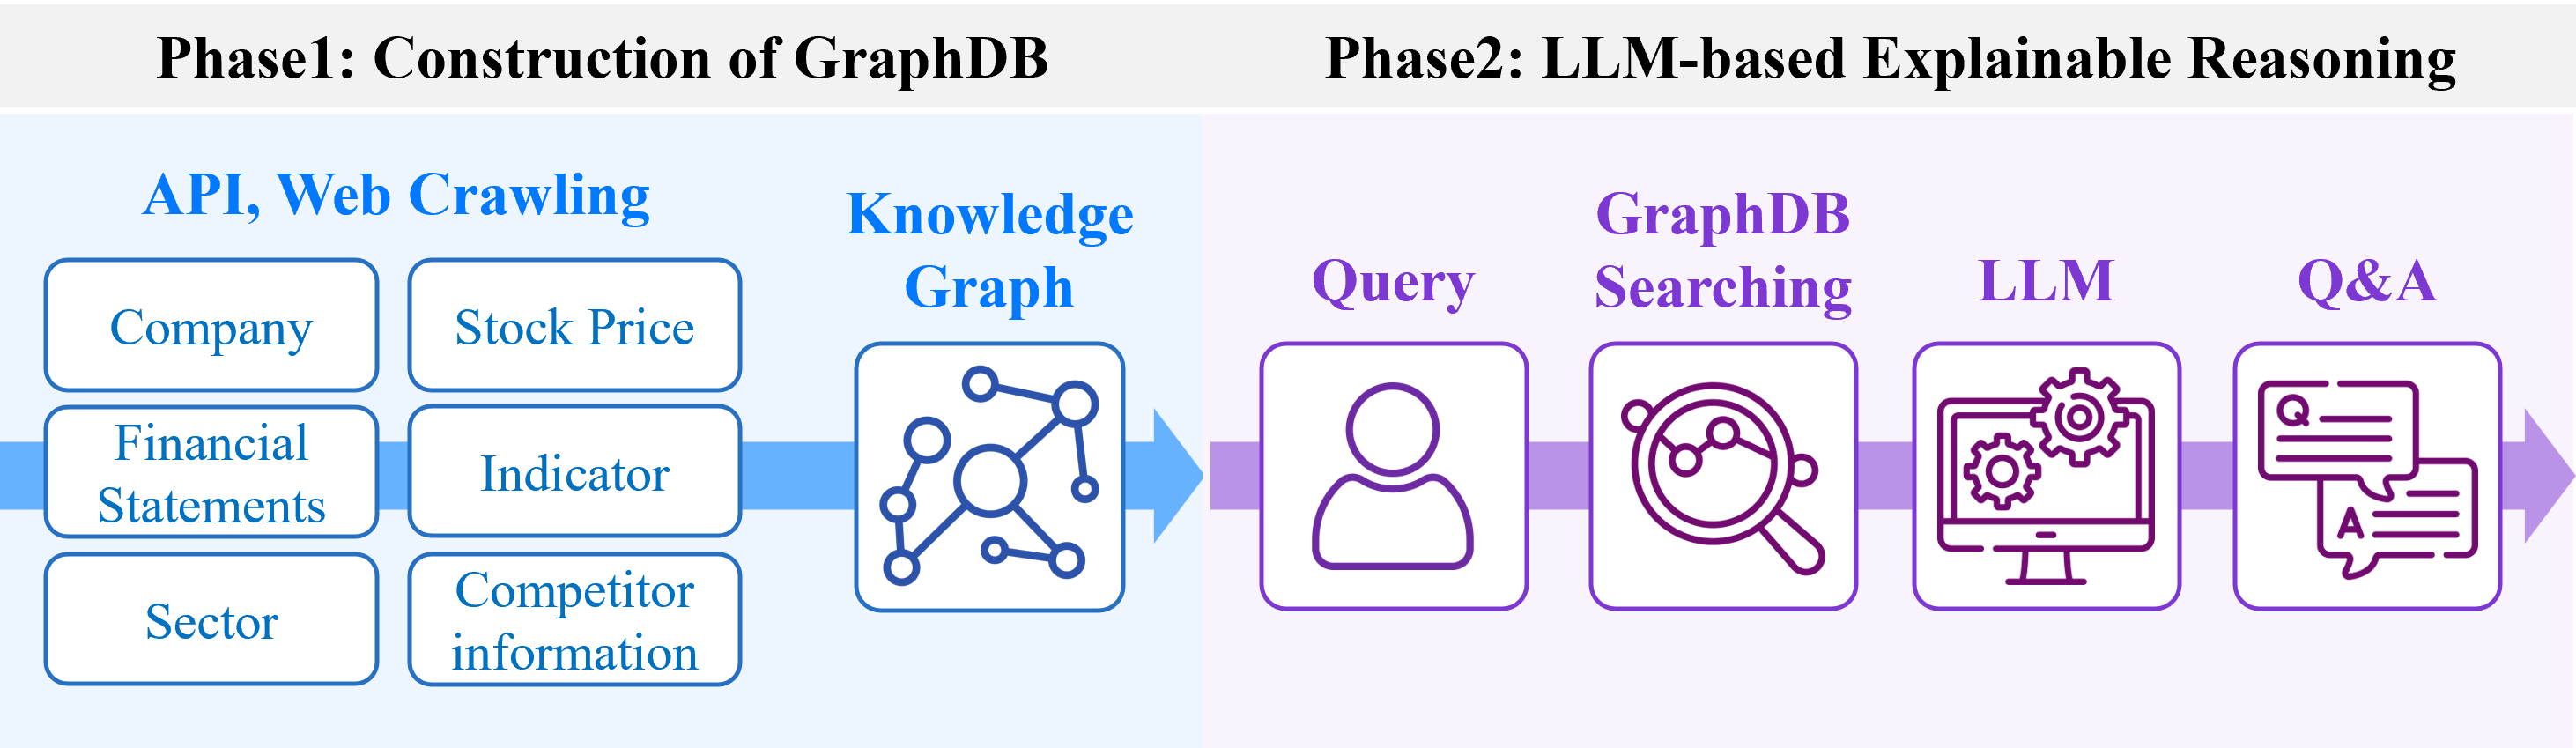
This paper details a framework for constructing a Korean stock market knowledge graph and integrating it with large language models to enable explainable multi-hop reasoning and enhance financial analysis.
Traditional financial analysis often struggles to capture the complex relational dynamics underpinning stock market behavior. This limitation motivates the work presented in ‘Knowledge Graph Construction for Stock Markets with LLM-Based Explainable Reasoning’, which proposes a novel framework integrating a knowledge graph of Korean listed companies with large language models. By enabling multi-hop reasoning and querying, this approach delivers explainable insights beyond conventional database analysis and time-series forecasting. Could this synergy between knowledge graphs and LLMs unlock a new era of actionable intelligence for investment strategies and decision support?
Beyond Prediction: Deconstructing the Limits of Financial Forecasting
Conventional stock price forecasting frequently prioritizes time-series analyses, such as Autoregressive Integrated Moving Average (ARIMA) and Long Short-Term Memory (LSTM) networks, which analyze historical price data to project future values. However, these approaches often operate in isolation, neglecting the intricate web of relationships that significantly influence stock performance. A reliance on purely temporal patterns overlooks critical factors like a company’s financial health, the broader industry landscape, and the competitive dynamics at play-data that, when integrated, can provide a more holistic and accurate assessment. This limitation becomes increasingly pronounced in complex markets, where stock movements aren’t solely dictated by past performance but are shaped by a confluence of interconnected variables.
Traditional stock analysis frequently falls short due to its limited capacity to synthesize a comprehensive range of influential factors; focusing predominantly on historical price data creates an incomplete picture of a company’s true value. While time-series models excel at identifying patterns within that data, they often neglect the critical interplay of company financials – encompassing debt, revenue, and profitability – alongside broader industry dynamics and the ever-shifting competitive landscape. This narrow focus hinders accurate assessment, as external forces and internal company health are pivotal in driving stock performance; consequently, predictions based solely on past prices may fail to anticipate responses to new information or unforeseen market shifts, leading to potentially flawed investment strategies and missed opportunities.
The Korean stock market, encompassing data from 2,879 listed companies across the 2023-2025 period, presents a uniquely intricate system where traditional time-series analysis falls short. Simple extrapolations of past performance fail to account for the complex interplay of factors influencing stock prices – from company-specific fundamentals and evolving industry dynamics to the competitive pressures inherent in a rapidly changing economic landscape. This necessitates analytical approaches that move beyond merely identifying temporal patterns and instead focus on uncovering the nuanced relationships between these diverse elements, offering a more holistic and potentially predictive understanding of market behavior. Successfully navigating this complexity requires methodologies capable of processing and interpreting vast datasets to reveal connections invisible to conventional techniques.
Structuring Financial Intelligence: The Rise of Knowledge Graphs
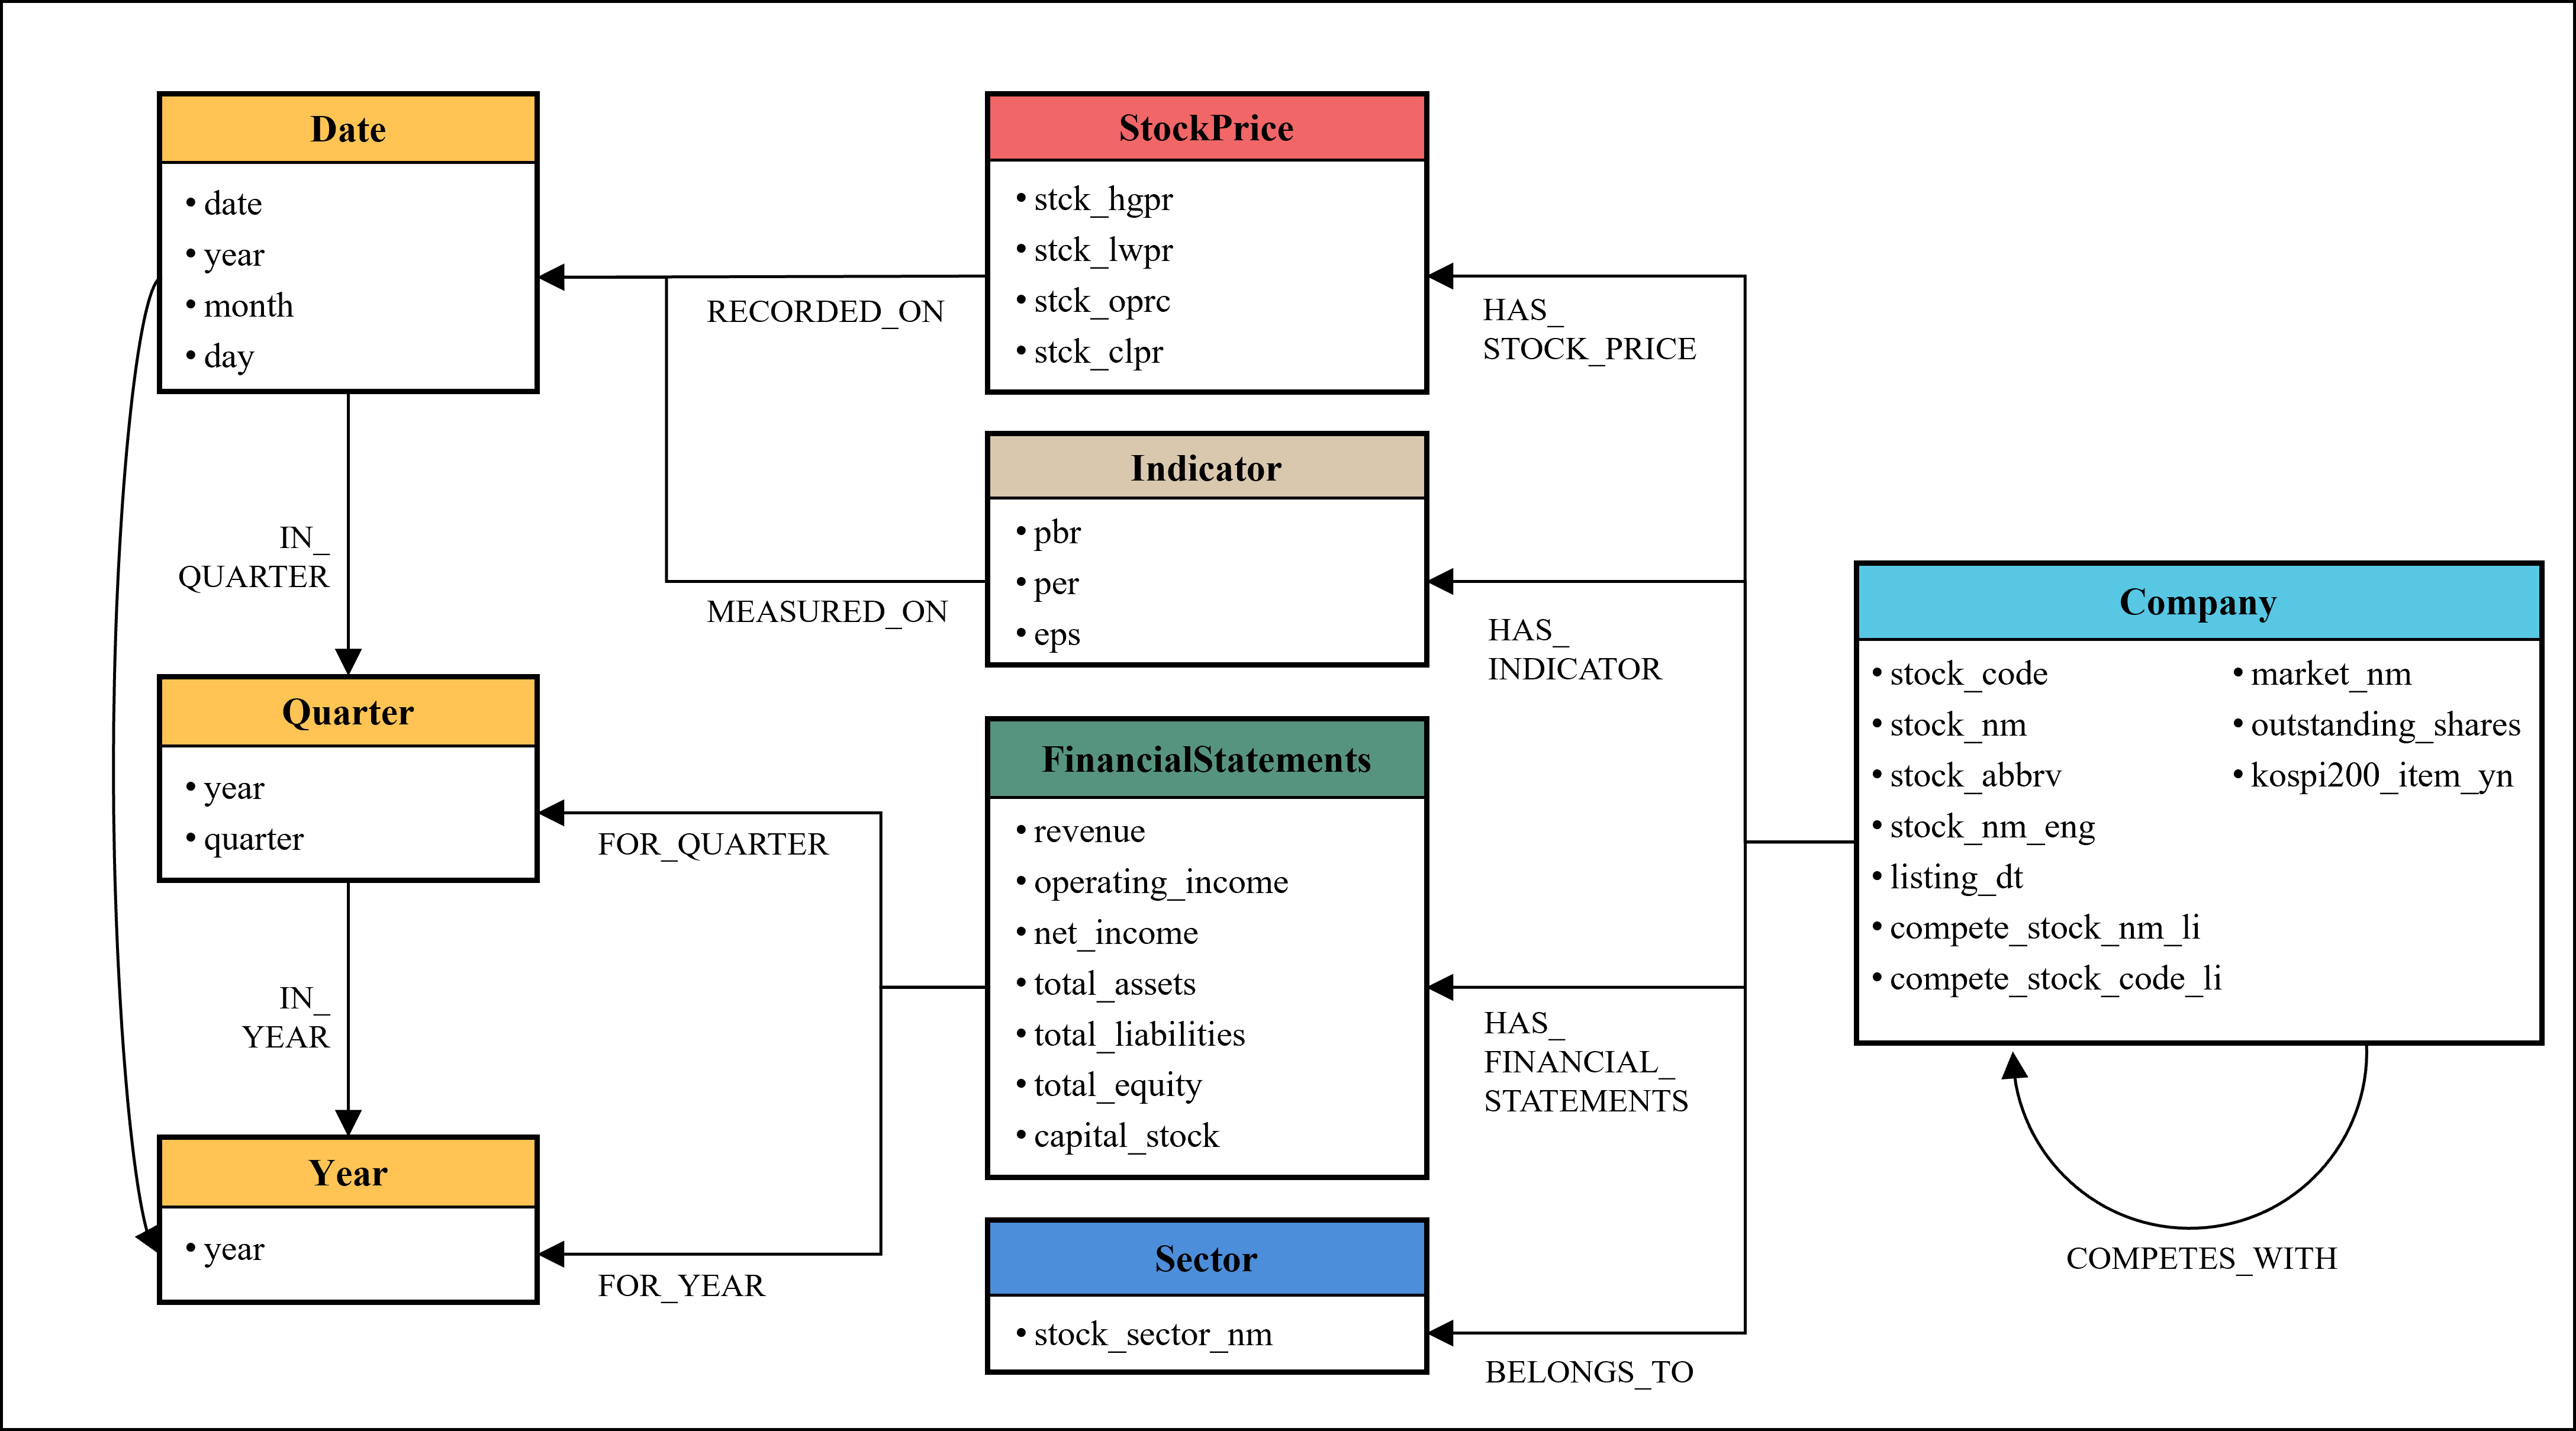
Knowledge Graphs represent a shift from traditional relational databases by focusing on the relationships between data points, rather than solely on the data itself. This is achieved by defining nodes to represent entities – such as companies, financial instruments, or economic indicators – and edges to define the connections between them, for example, ‘owns’, ‘influences’, or ‘is_correlated_with’. Unlike tabular data, this structure allows for flexible schema and the easy incorporation of new data types and relationships without requiring extensive schema migrations. The resulting graph structure facilitates a more nuanced understanding of complex financial systems, moving beyond simple data storage to a representation that models real-world connections and dependencies.
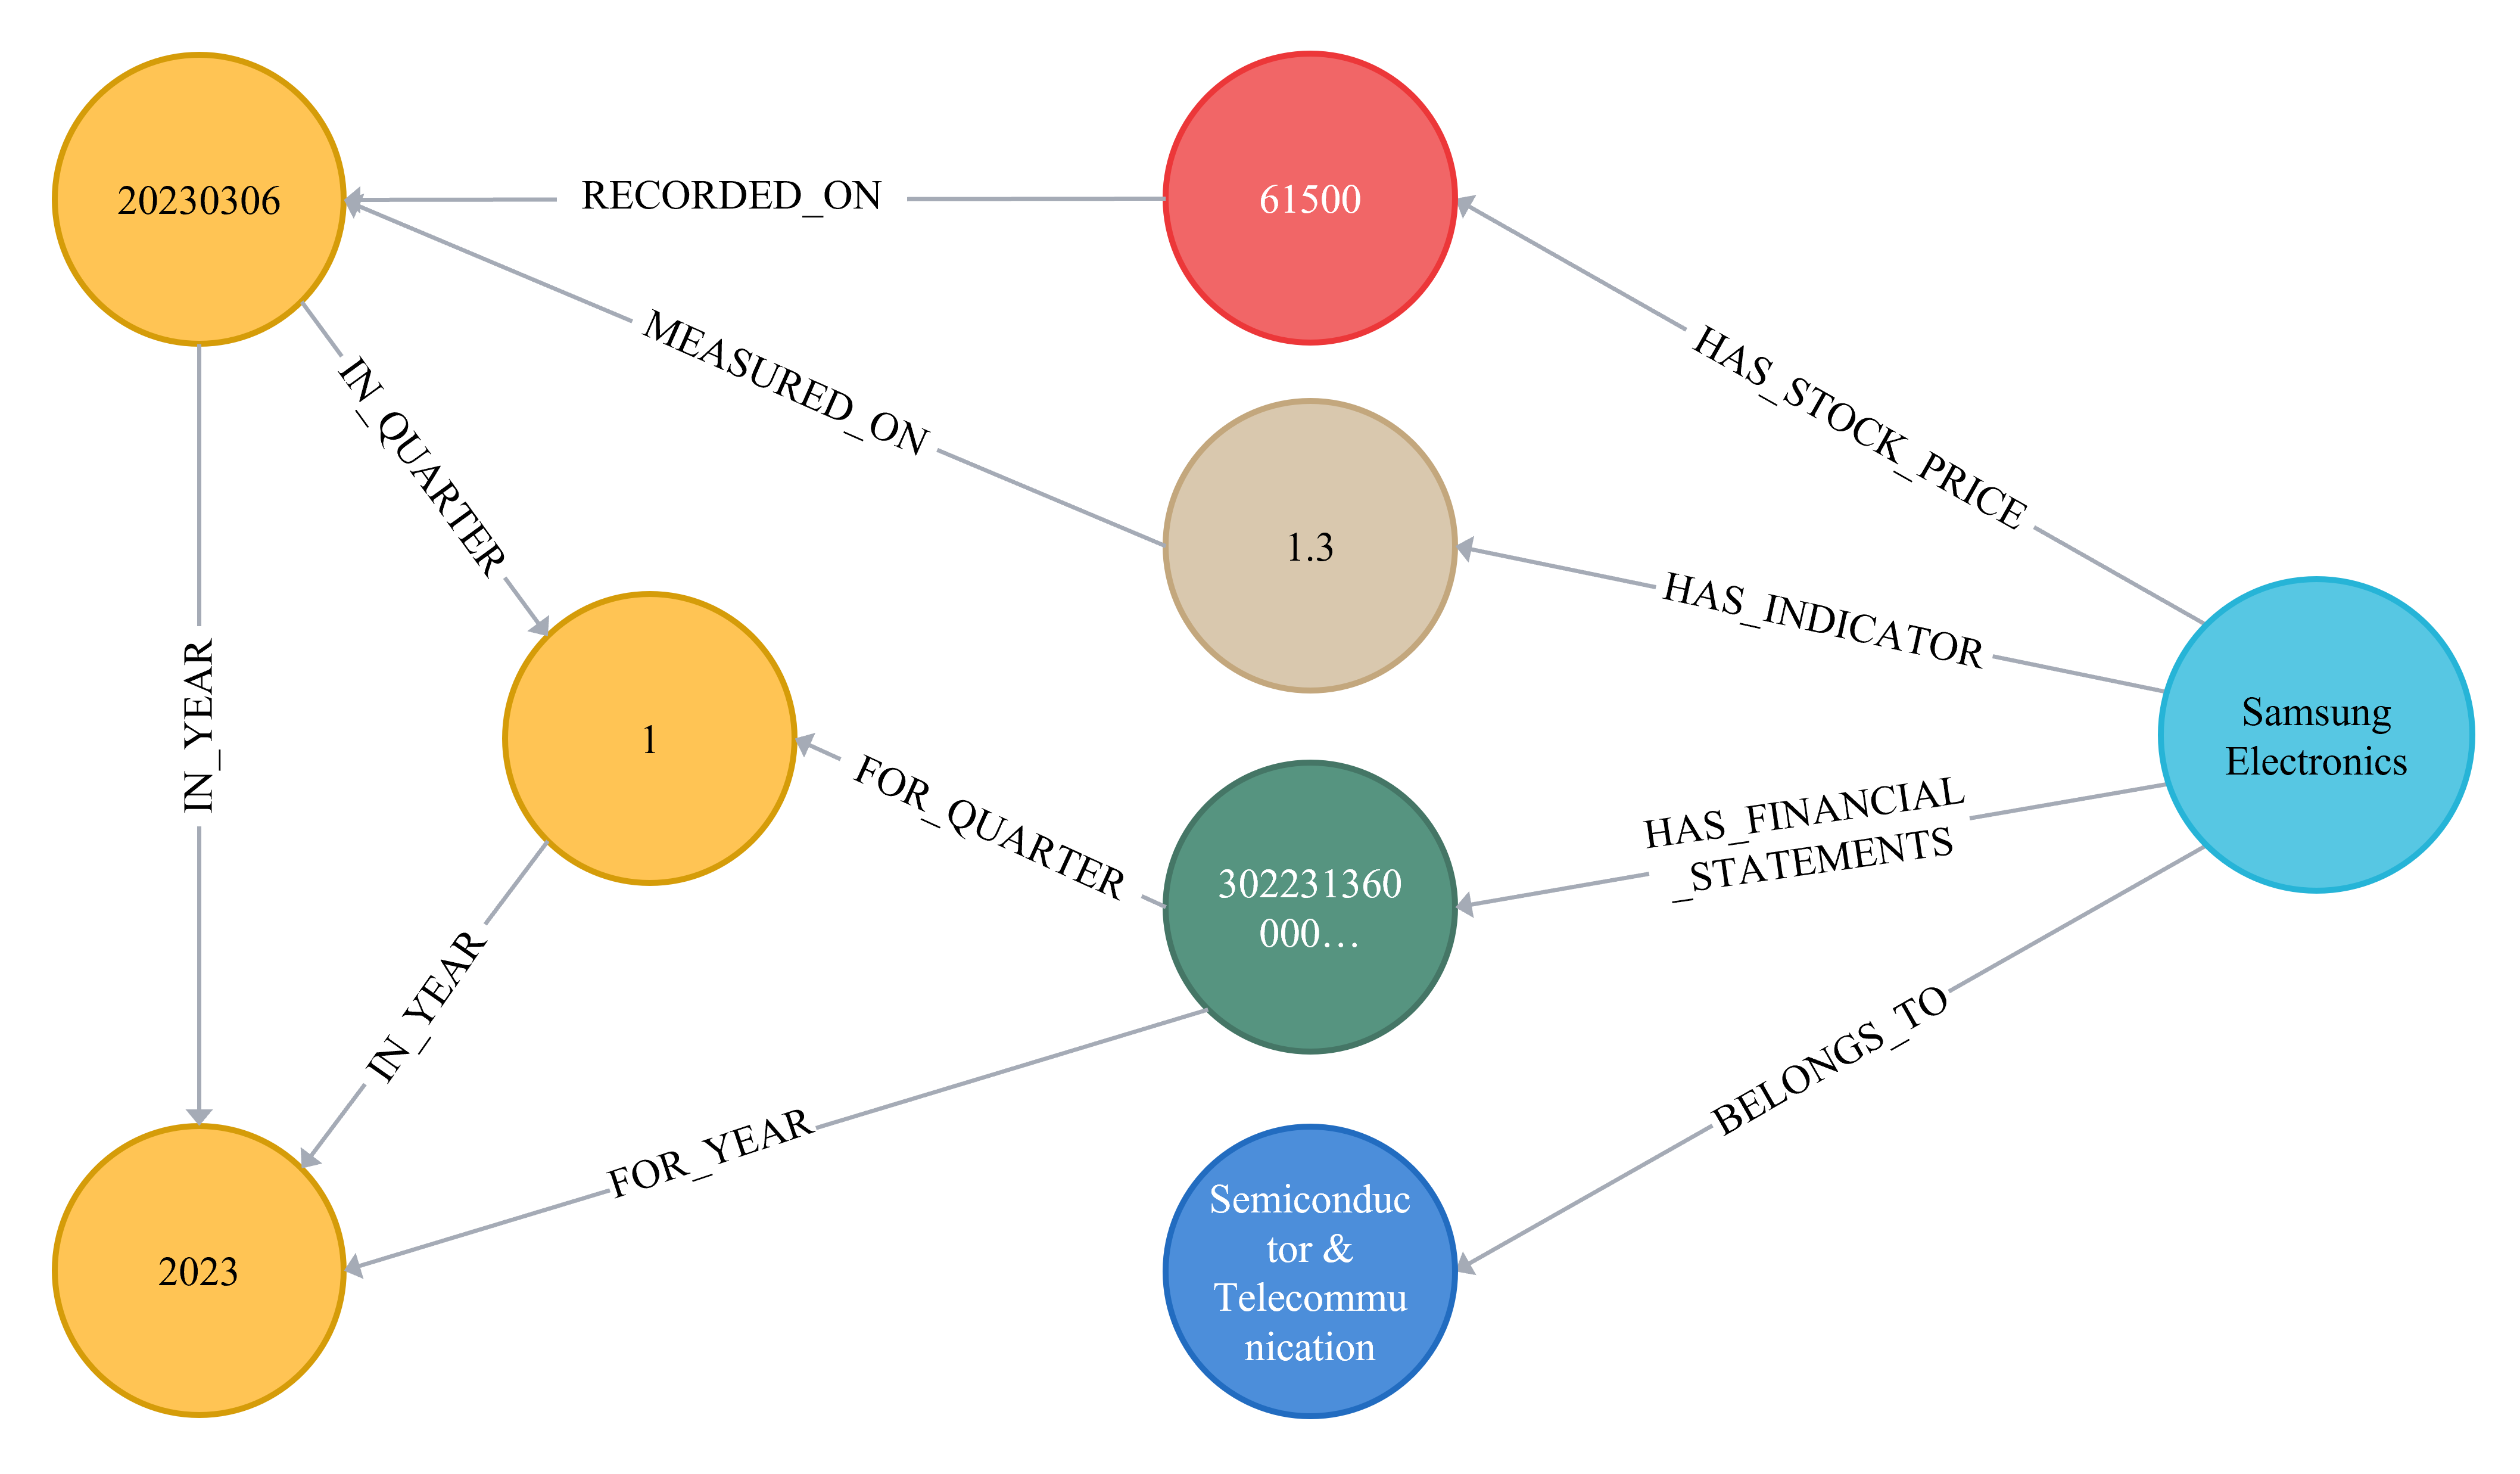
Modeling financial data as a graph facilitates multi-hop reasoning by representing financial instruments, entities, and events as nodes and their interrelationships as edges. This structure allows for traversal beyond direct connections; for example, identifying a company’s ultimate beneficial owner through a chain of ownership relationships, or detecting potential fraud by linking seemingly unrelated transactions through shared accounts or individuals. Unlike relational databases requiring complex joins, graph databases efficiently navigate these connections, revealing indirect relationships and dependencies that would be difficult or impossible to uncover through traditional methods. This capability is critical for tasks such as risk assessment, regulatory compliance, and investigative analysis, where understanding complex networks is paramount.
Neo4j is a highly scalable, native graph database utilized for managing and querying complex relationships within financial datasets. Its architecture is optimized for traversing connections, offering performance advantages over relational databases when analyzing interconnected data. The Cypher Query Language, specifically designed for Neo4j, enables intuitive and efficient data retrieval using pattern matching and graph traversals. This combination allows for the practical implementation of knowledge graphs at scale, capable of storing and processing millions of nodes representing entities – such as companies, transactions, and indicators – and the relationships between them, while maintaining query performance and data integrity.
GraphRAG: Bridging the Gap Between Language Models and Financial Knowledge
GraphRAG leverages the complementary strengths of Large Language Models (LLMs) and graph databases to improve both analytical reasoning and the transparency of results. LLMs excel at natural language understanding and generation, but often lack access to structured, relational data and can struggle with complex reasoning tasks requiring multiple data hops. Graph databases, conversely, provide a robust framework for storing and querying interconnected data. By integrating these technologies, GraphRAG enables LLMs to access and reason over structured financial knowledge, improving the accuracy and reliability of generated responses. Furthermore, the graph structure provides a clear audit trail of the data and relationships used to arrive at a conclusion, significantly enhancing interpretability compared to traditional LLM-based approaches.
LangChain provides the necessary tooling to translate user queries expressed in natural language into executable Cypher queries, the query language for graph databases. This conversion process involves parsing the natural language input to identify key entities, relationships, and desired information, then mapping these elements to the corresponding nodes and edges within the financial knowledge graph. The resulting Cypher query is then executed against the graph database, retrieving relevant data which is subsequently utilized by the LLM to formulate a response. This approach eliminates the need for users to directly write Cypher, allowing for intuitive data access and analysis even without specialized graph query knowledge.
GPT-4.1 functions as the central Large Language Model within the GraphRAG system, responsible for synthesizing information retrieved from the knowledge graph. Following the conversion of a natural language query into a Cypher query and subsequent data retrieval, GPT-4.1 processes the graph data – including nodes, edges, and associated properties – to formulate a coherent and contextually relevant response. Its capabilities extend beyond simple information recall; the model leverages its understanding of relationships represented within the graph to draw inferences and generate answers that reflect a deeper comprehension of the financial knowledge base. This process enables the system to provide insightful responses grounded in structured data, going beyond the limitations of purely text-based LLM applications.
Unlocking Financial Insights: From Data Acquisition to Strategic Analysis
Access to comprehensive financial data is paramount for informed decision-making, and the knowledge graph relies heavily on data obtained from the KIS Developers API and OpenDART API. These APIs deliver a wealth of essential information, ranging from real-time stock indicators – such as trading volume and price fluctuations – to detailed financial statements including balance sheets, income statements, and cash flow reports. This continuous influx of data allows for dynamic updates to the knowledge graph, ensuring its accuracy and relevance. By systematically integrating these diverse data streams, the system builds a robust and interconnected representation of financial relationships, which is foundational for deeper analysis and the identification of valuable insights within the Korean stock market.
A comprehensive competitive landscape emerges through the integration of financial data from 2,879 companies. This extensive dataset allows for detailed assessments of individual firm performance, pinpointing core competencies and areas requiring improvement. By analyzing key financial ratios, growth metrics, and market positioning, relative strengths and weaknesses become readily apparent. This granular level of insight extends beyond simple comparisons; it facilitates a nuanced understanding of how each company stacks up against its peers, revealing strategic vulnerabilities and opportunities for differentiation within the Korean stock market. The resulting analysis provides a powerful tool for investors seeking to make informed decisions and identify companies poised for sustained success.
Refined sector-level analysis, enabled by comprehensive data integration, reveals dynamic shifts and promising avenues for investment within the Korean stock market. This approach moves beyond simple categorization, identifying not just which sectors are performing well, but how and why. By scrutinizing financial data across 2,879 companies, emerging trends – such as the rapid growth of renewable energy technologies or the impact of evolving consumer preferences – become clearly visible. This granular understanding allows for the pinpointing of potential investment opportunities before they become widely recognized, providing a significant advantage in a competitive market and fostering a more informed, proactive investment strategy.
Beyond Prediction to Proactive Intelligence: The Future of Financial Analysis
The financial world is characterized by intricate relationships – a company’s performance isn’t solely determined by its own metrics, but also by its suppliers, competitors, and the broader economic climate. Extending the current framework to incorporate Graph Neural Networks allows for the modeling of these complex interdependencies with unprecedented nuance. Unlike traditional methods that treat entities in isolation, these networks can identify subtle, non-linear correlations often missed by conventional analysis. By representing financial instruments and institutions as nodes within a graph, and their relationships as edges, the system can learn patterns from the network structure itself. This capability promises to unlock a deeper understanding of systemic risk, identify emerging opportunities, and ultimately, move beyond simply predicting market behavior to discerning the underlying forces that shape it.
The future of financial intelligence hinges on the ability to move beyond static analysis and embrace a continuously evolving understanding of market dynamics. Real-time data integration, encompassing news feeds, social media sentiment, and transactional records, fuels this evolution. This influx of information isn’t simply stored, but actively incorporated into a knowledge graph – a network representing entities and their relationships. Continuous updates to this graph allow for the immediate identification of emerging risks and opportunities, shifting from reactive prediction – anticipating what will happen – to proactive intelligence, enabling dynamic investment strategies that adjust to conditions as they unfold. This constant refinement of the knowledge base ensures that risk management isn’t based on historical patterns alone, but on a current, nuanced understanding of the complex interplay between market forces.
The evolving financial landscape demands more than simply forecasting future trends; it requires a transition towards proactive intelligence. Current predictive models largely operate by analyzing historical data to anticipate what will happen, placing investors in a position of reaction. This new framework, however, aims to fundamentally alter that dynamic by constructing a continuously updated knowledge graph that reveals underlying relationships and potential systemic vulnerabilities. By understanding why certain events are likely to occur, and anticipating secondary effects before they manifest, investors are empowered to move beyond damage control and actively shape their portfolios for optimal performance. This shift fosters a state of informed preparedness, enabling strategic interventions and ultimately transforming financial decision-making from a reactive process to a proactive and intelligent one.
The pursuit of actionable insights, as demonstrated by this knowledge graph construction, echoes a fundamental principle of understanding any complex system. One dismantles assumptions to reveal underlying mechanisms. As Bertrand Russell aptly stated, “The difficulty lies not so much in developing new ideas as in escaping from old ones.” This framework, integrating a Korean stock market knowledge graph with large language models, actively challenges traditional financial analysis by moving beyond simple correlations. It’s a deliberate attempt to ‘break’ the existing system – to test its limits through explainable, multi-hop reasoning – and, in doing so, construct a more robust understanding of market dynamics. The result isn’t merely prediction, but a demonstrable rationale behind those predictions, born from reverse-engineering the data itself.
What Breaks Down Next?
The construction of a knowledge graph, even one fueled by large language models, merely establishes a map-not necessarily a true representation. This work elegantly demonstrates the potential for multi-hop reasoning within Korean stock markets, but the inherent fragility of such systems warrants consideration. If the LLM’s ‘understanding’ is, at its core, pattern matching-a sophisticated mimicry of correlation-then stress-testing the graph with genuinely novel market conditions becomes paramount. Can it extrapolate beyond the data it has consumed, or will it simply rearrange existing ‘knowledge’ into increasingly complex, yet ultimately flawed, predictions?
The real challenge isn’t building bigger graphs, but dismantling them. The system’s limitations will reveal themselves not through successful predictions, but through spectacular failures – the anomalies it cannot explain. Identifying these breaking points-the specific combinations of factors that invalidate the LLM’s reasoning-is where genuine insight lies. One anticipates, for example, that shifts in regulatory policy, or entirely new financial instruments, will quickly expose the boundaries of its ‘knowledge’.
Future work should therefore prioritize adversarial testing. Deliberately constructing scenarios designed to mislead the system-introducing false signals, or subtly altering the underlying data-will be far more informative than simply optimizing for accuracy on historical data. Only by attempting to break it can one truly understand how, and why, it functions – and, crucially, when it does not.
Original article: https://arxiv.org/pdf/2601.11528.pdf
Contact the author: https://www.linkedin.com/in/avetisyan/
See also:
- United Airlines can now kick passengers off flights and ban them for not using headphones
- Gold Rate Forecast
- How to Solve the Glenbright Manor Puzzle in Crimson Desert
- 8 Actors Who Could Play Blackbeard In One Piece Live-Action Season 3
- All Golden Ball Locations in Yakuza Kiwami 3 & Dark Ties
- How to Get to the Undercoast in Esoteric Ebb
- How to Complete Bloom of Tranquility Challenge in Infinity Nikki
- $2B AI cow collars use “cowgorithm” to herd cattle with no fences
- Binance’s Bold Bitcoin Bet: $1B SAFU Fund Dives Into Crypto’s Deep End
- All MLB The Show 26 Quirks & What They Do
2026-01-22 01:26