Bitcoin is clinging to the $86K mark like a tourist to their last slice of pizza in Rome-desperate and slightly pathetic. But don’t be fooled; this market’s got more twists than a bowl of spaghetti. Sure, the 4-hour chart flickers with hope, but the broader technicals are screaming “sell” louder than a street vendor in Naples. 🍕💨
Bitcoin Chart Outlook
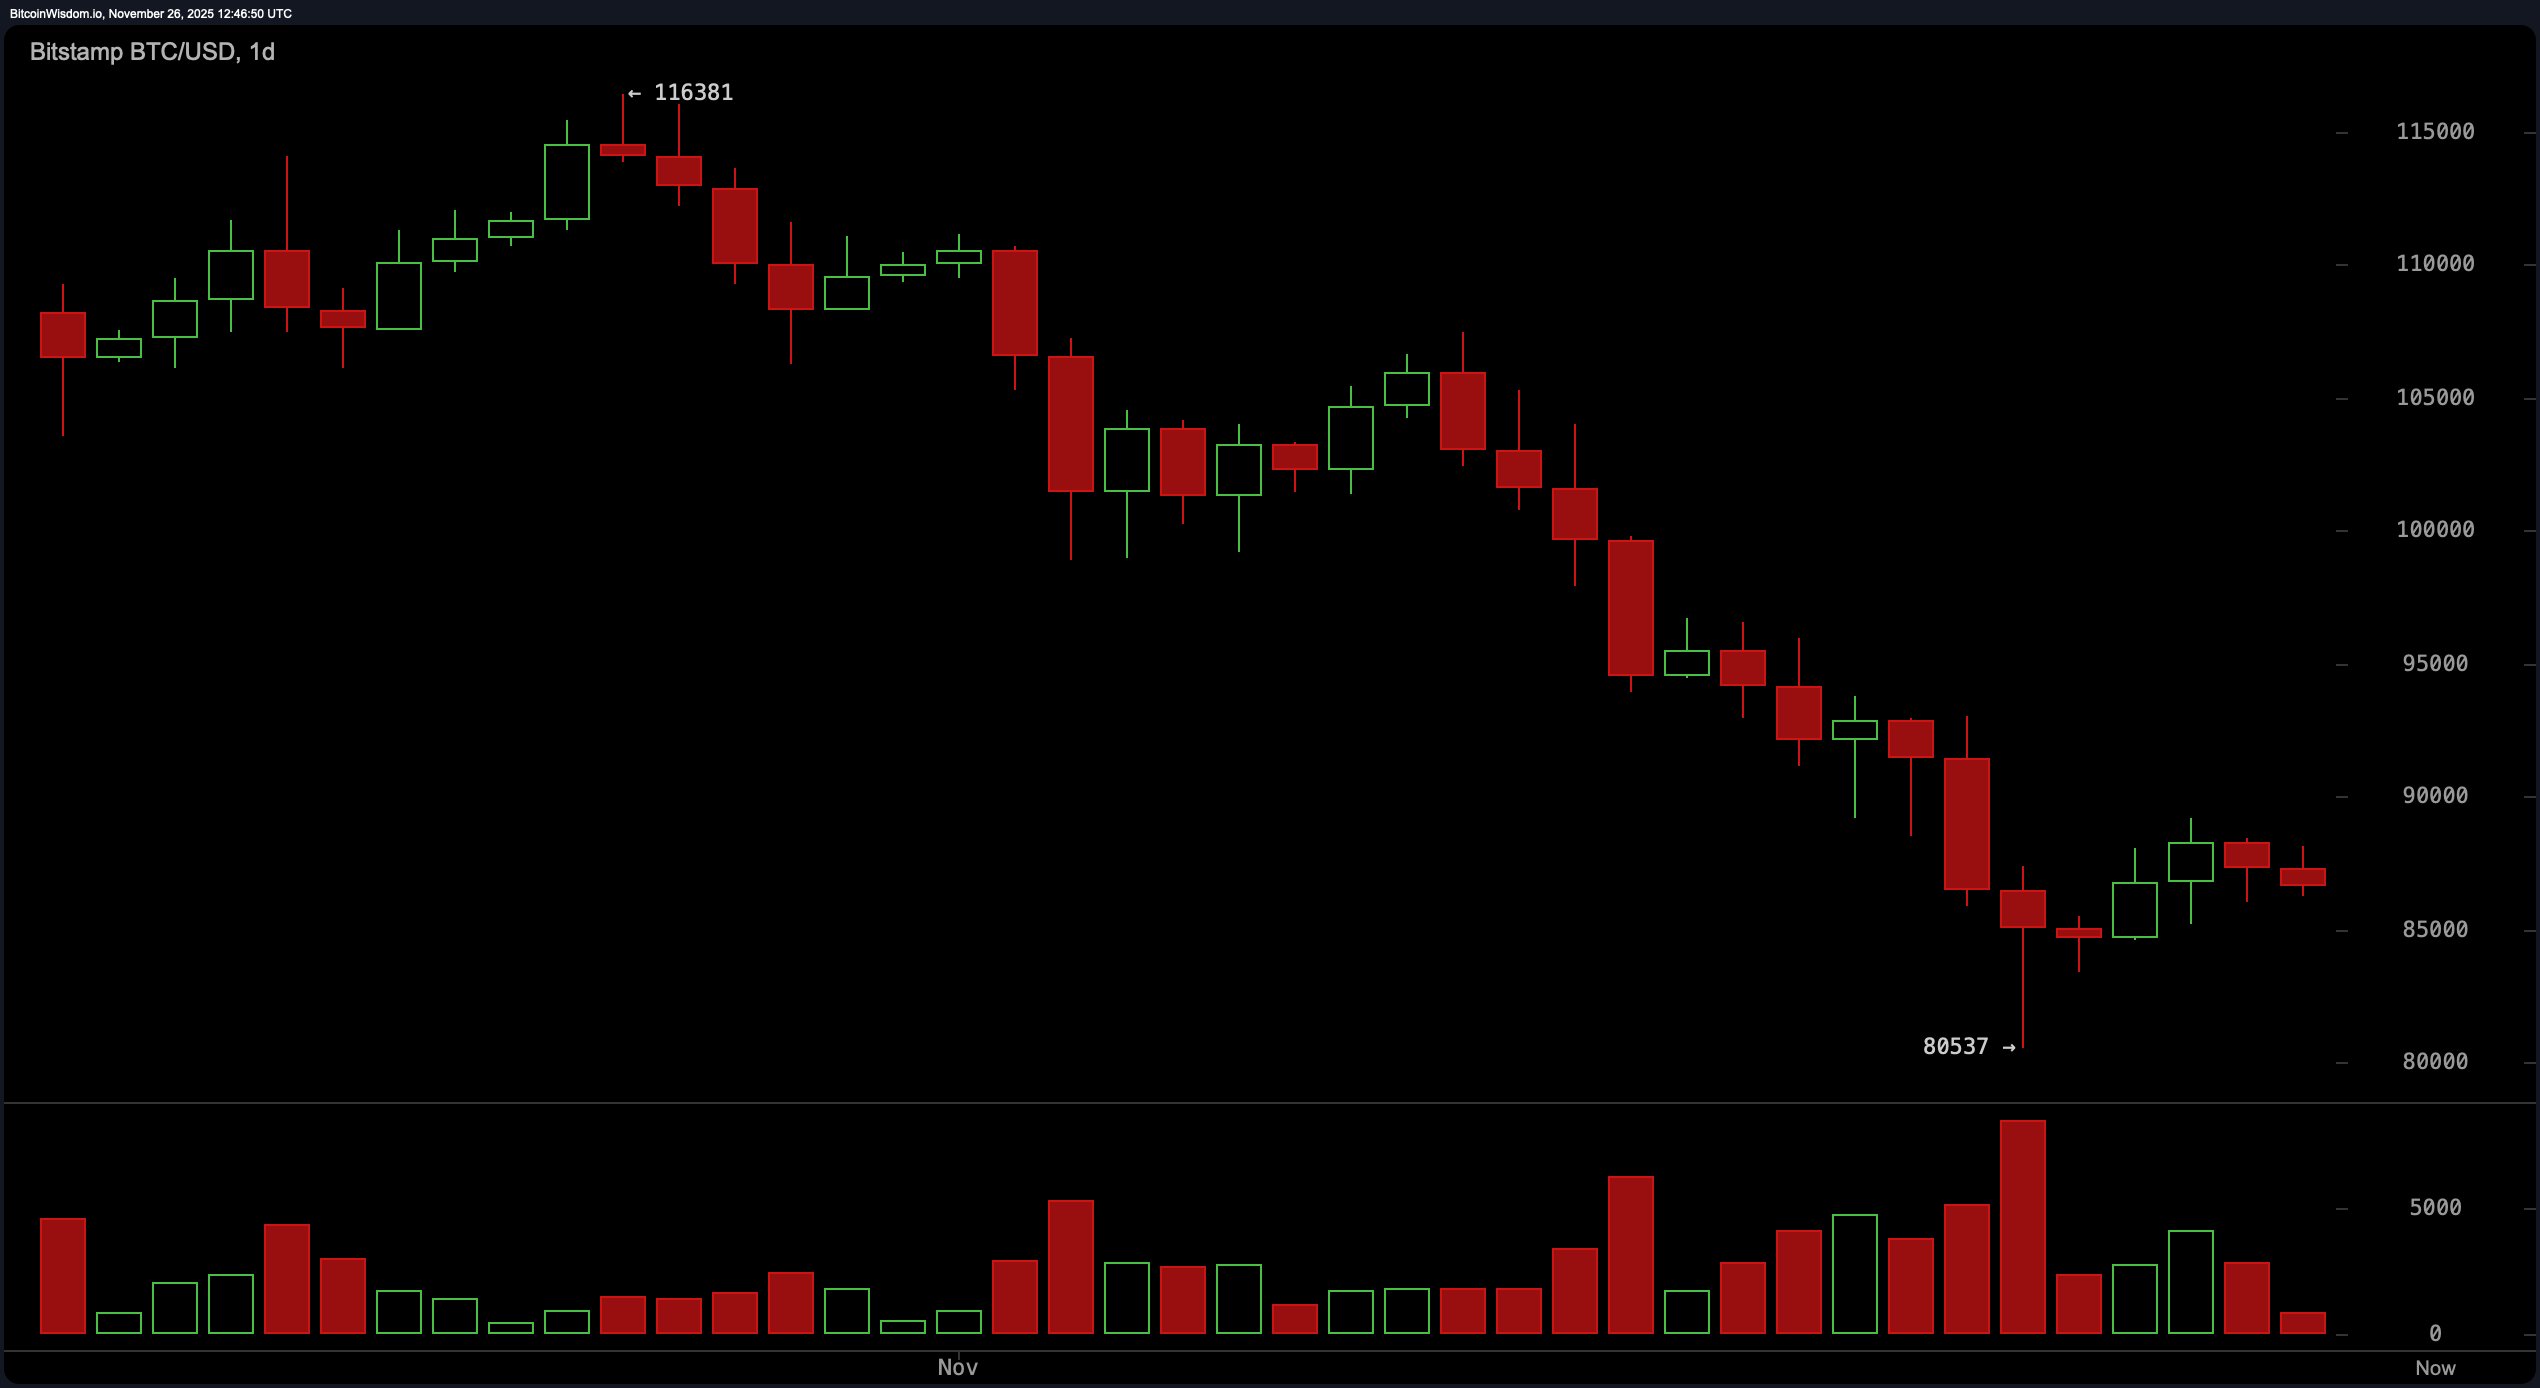
Let’s dive into the daily chart, which is throwing shade like a British summer. Bitcoin’s in a downtrend so steep it makes the Alps look flat, sliding 30% from its recent highs. Its “rebound” from $80,000? More like a wobbly toddler taking its first steps. 👶💔
Volume? Surging on red candles like a Black Friday sale gone wrong. The price is bobbing around $87K-$89K, but until it breaks $90K, it’s just gravity’s plaything. 🌍🤹♂️
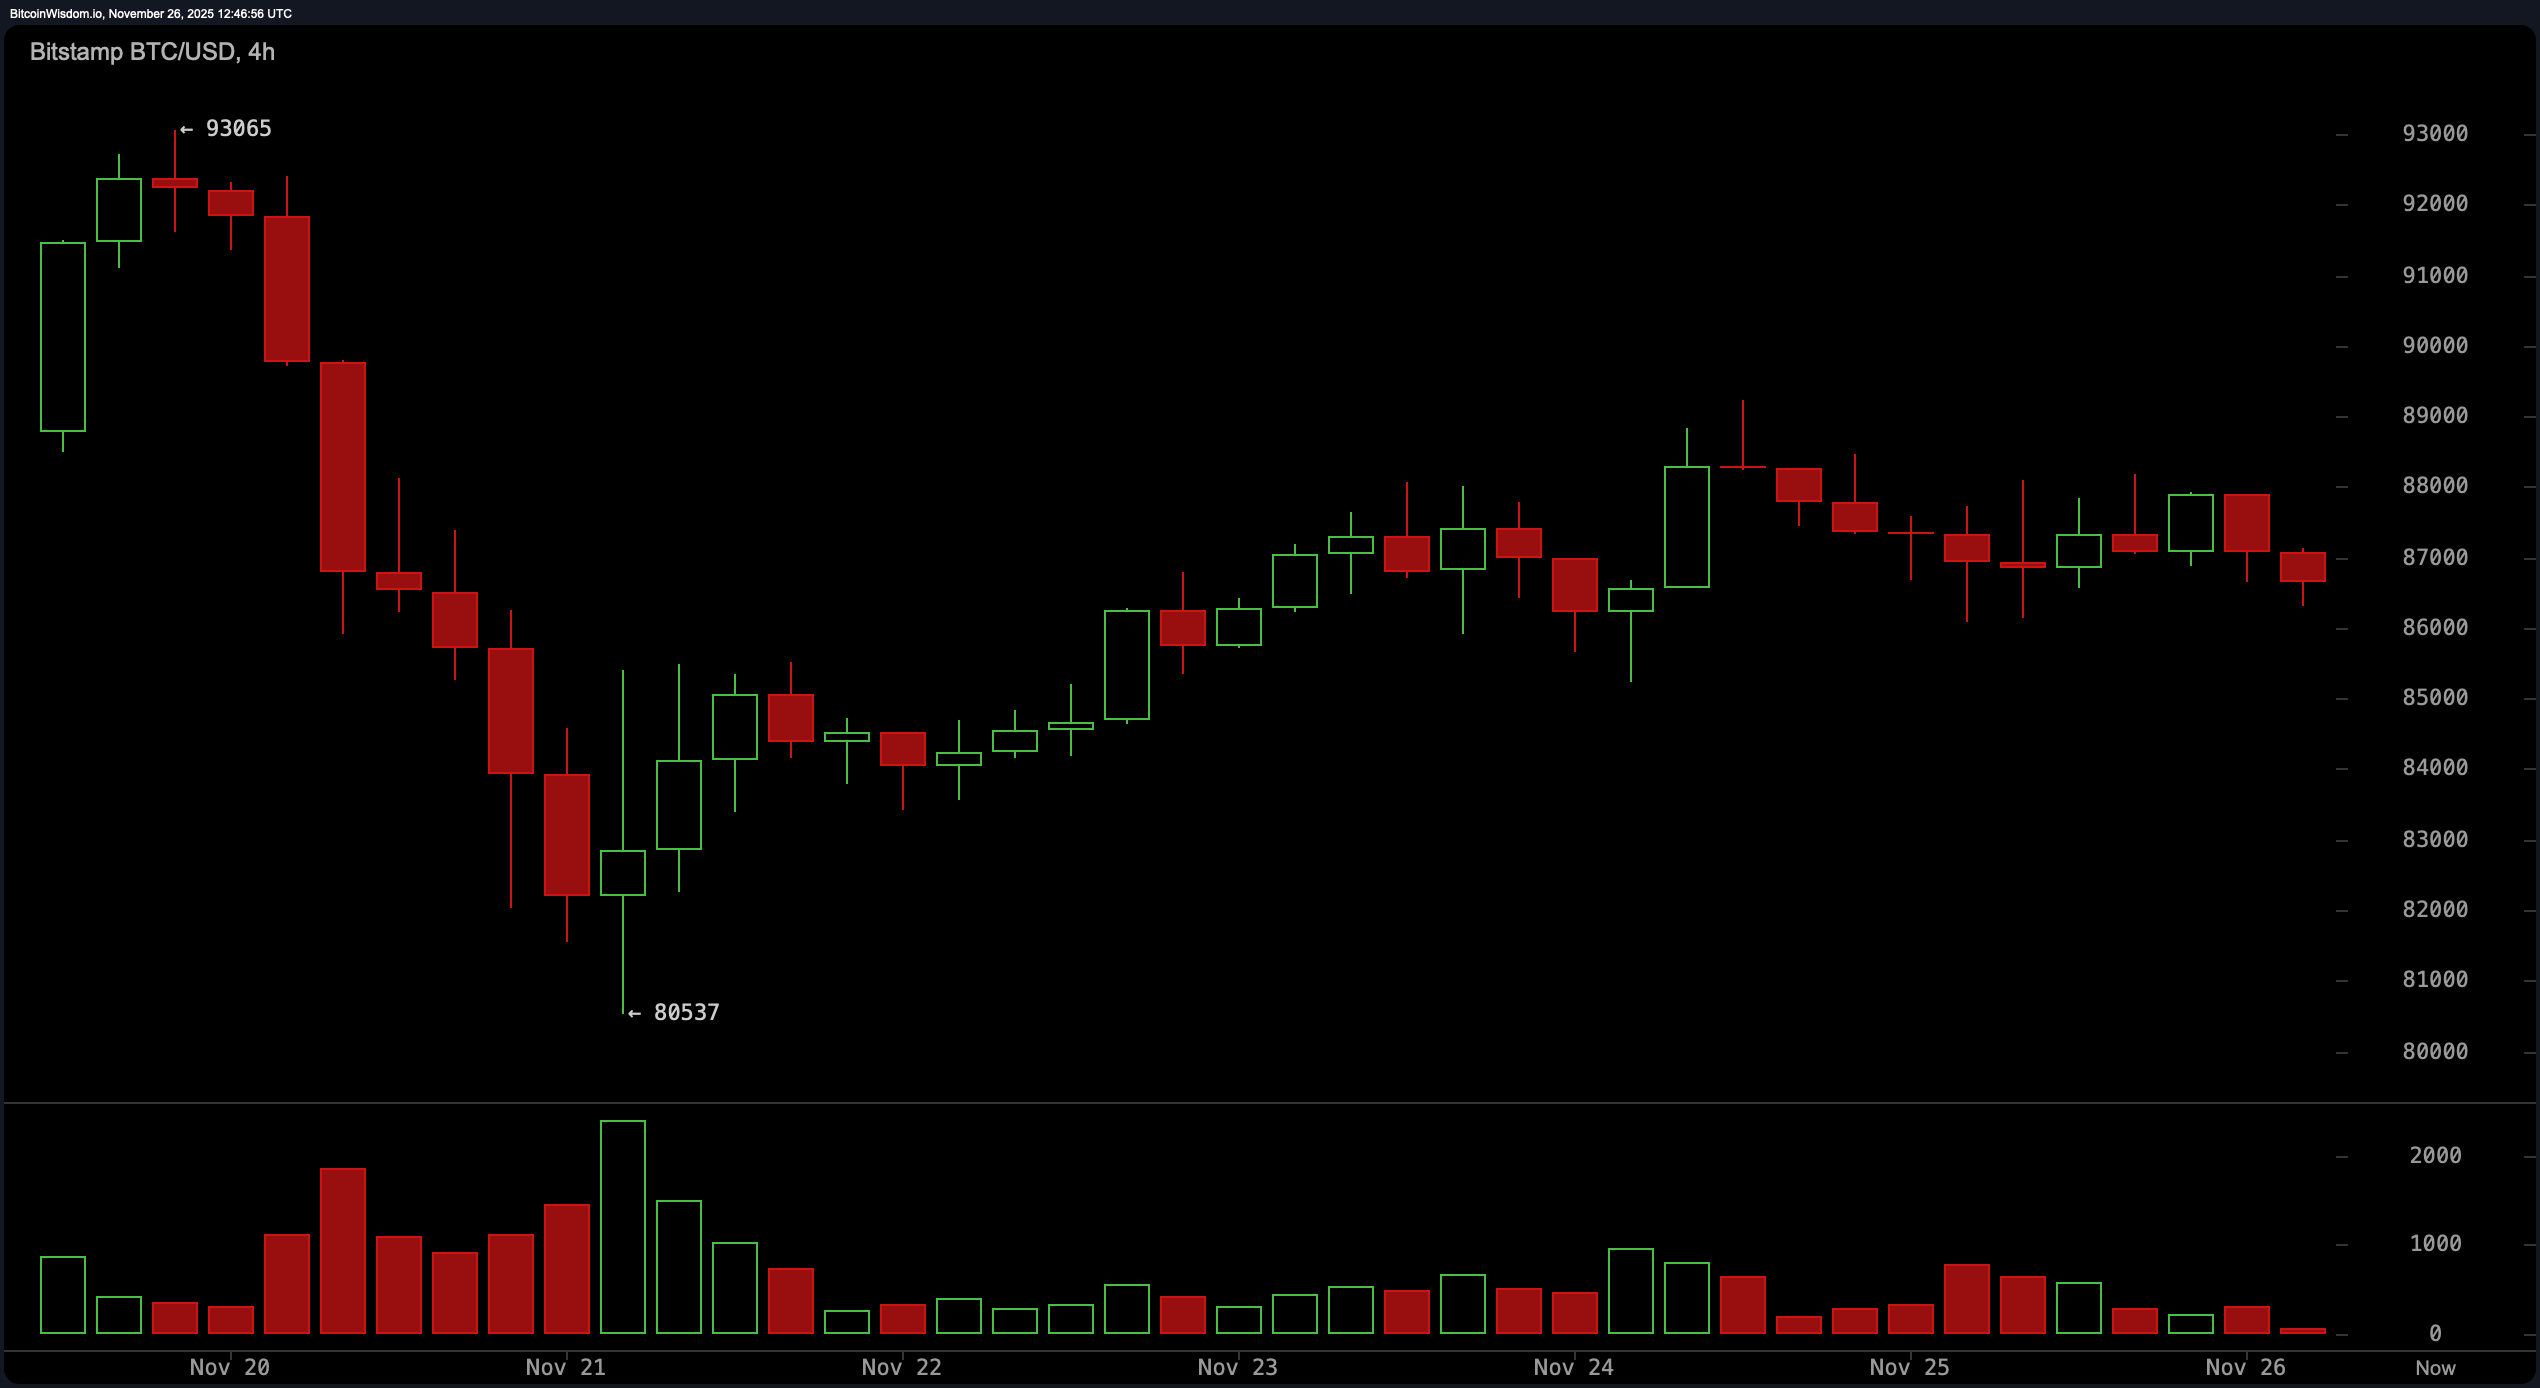
The 4-hour chart? Slightly less doom and gloom, like a cloudy day with a hint of sunshine. Bitcoin rallied from $80,537 to $89,000, only to enter a sideways flag that screams “I’m indecisive.” Traders, grab your popcorn-this consolidation battle between $86K and $89K is the only show in town. 🍿⚔️
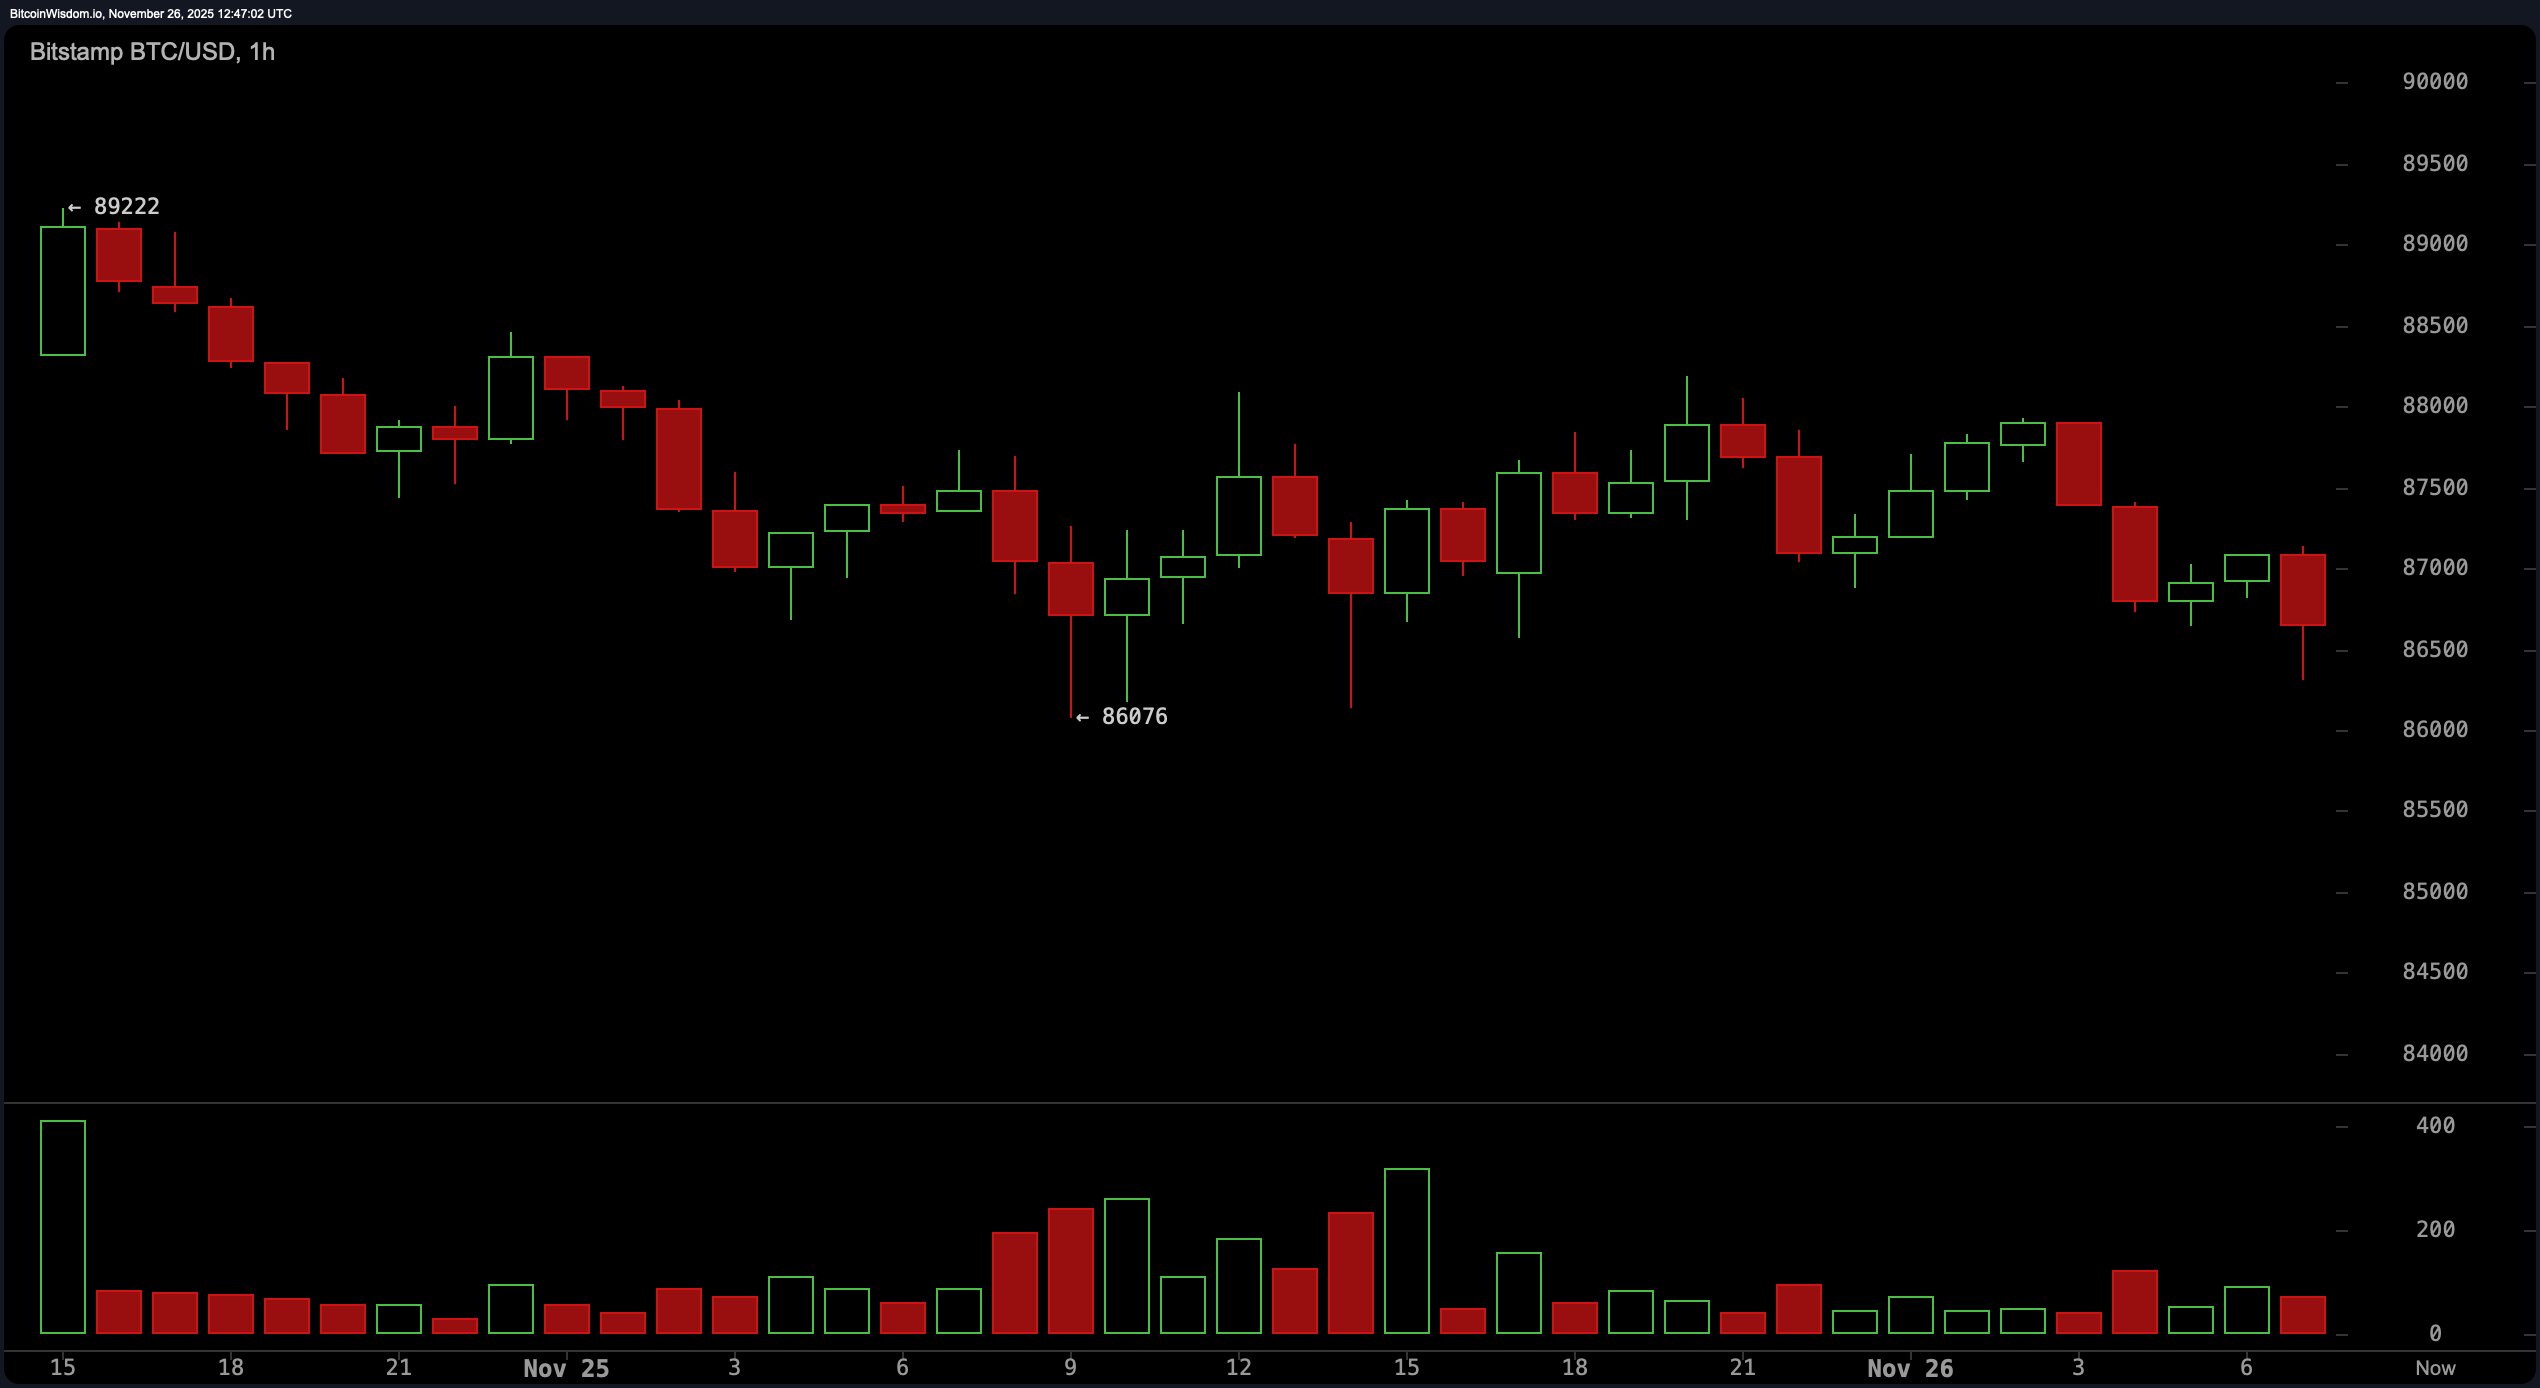
Zoom into the 1-hour chart, and it’s a snooze-fest with a bearish twist. Bitcoin’s ping-ponging between $86,500 and $89,000, but don’t be fooled-this isn’t Wimbledon. Bearish candlesticks outnumber bullish ones like grumpy cats at a dog party. 🐻🐱
Indicators? They’re as neutral as Switzerland in a world war. RSI at 31, stochastic at 27, CCI at −79-basically, they’re all shrugging. 🧑🤷♀️ The momentum oscillator’s trying to be optimistic at −7,549, but the MACD at −5,512 is giving it the side-eye. It’s a market identity crisis. 🤷♂️
Moving averages? A graveyard of resistance levels. From the 10-period EMA at $89,021 to the 200-period SMA at $109,968, they’re all bearish. Even the 50-period EMA, usually the optimist of the group, is declining at $101,138. It’s like a funeral procession, but for charts. ⚰️
In short, Bitcoin’s in a tug-of-war between momentum and long-term pessimism. It needs a miracle-or at least a breakout above $90K-to turn this ship around. Until then, it’s a cautionary tale, not a comeback. 🚢⚠️
Bull Verdict:
If Bitcoin can break $90K with the volume of a rock concert, bulls might roar back. A higher low above $80K and renewed momentum could spark a reversal. But let’s not hold our breath-it’s more dream than reality. 🎸🦁
Bear Verdict:
With moving averages stacked like pancakes and a downtrend firmer than a British upper lip, the path of least resistance is down. If $86K fails, $83K-or even $80K-is next. It’s not just possible; it’s practically written in the stars. 🥞🔮
FAQ ❓
- What’s Bitcoin’s price now?
Trading at $86,411 as of November 26, 2025. 📊 - Is Bitcoin in a downtrend?
Yes, stronger than a British cup of tea. ☕💪 - What levels should I watch?
$86K for support, $90K for resistance. Keep your eyes peeled. 👀 - Are indicators bullish?
Neutral to bearish-like a Monday morning. 🌧️
Read More
- United Airlines can now kick passengers off flights and ban them for not using headphones
- Crimson Desert: Disconnected Truth Puzzle Guide
- How to Get to the Undercoast in Esoteric Ebb
- All 9 Coalition Heroes In Invincible Season 4 & Their Powers
- All Golden Ball Locations in Yakuza Kiwami 3 & Dark Ties
- Warframe Voruna Prime access begins on April 8 for all platforms, new deluxe cosmetic Warframe skins revealed
- Katanire’s Yae Miko Cosplay: Genshin Impact Masterpiece
- Zendaya’s 4 Big 2026 Movies Could Beat Brie Larson’s Box 2019 Office Record
- Dakota County’s plan to end hunger involves locking mayors in escape rooms
- All Itzaland Animal Locations in Infinity Nikki
2025-11-26 17:19