Author: Denis Avetisyan
Traditional risk measures often fall short in capturing the full spectrum of potential losses, and this research proposes a refined framework based on magnitude and propensity to provide a more nuanced assessment.

This paper extends frequency-severity risk assessment using a three-point distribution and optimal transport to improve upon Value-at-Risk and Expected Shortfall.
Despite decades of refinement, conventional risk measures often fail to capture the complex, multivariate nature of financial risk. This limitation motivates the research presented in ‘Informative Risk Measuresin the Banking Industry: A Proposal based on the Magnitude-Propensity Approach’, which proposes a novel extension of the frequency-severity framework. By representing risk through a three-point distribution-zero, moderate, and extreme losses-this approach offers a more interpretable and robust characterization of potential portfolio losses than traditional scalar measures like Value-at-Risk and Expected Shortfall. Could this multivariate representation provide a more effective foundation for both regulatory oversight and proactive risk management in the banking sector?
Deconstructing Risk: Beyond the Illusion of Control
For decades, Value at Risk – or VaR – served as a foundational tool in financial risk management, offering a seemingly straightforward method for quantifying potential losses over a specific time horizon. However, growing awareness of its shortcomings, particularly in capturing tail risk, has prompted a critical reassessment of its reliability. VaR calculates the maximum loss expected with a given confidence level, but this approach often relies on statistical assumptions – such as normally distributed returns – that fail to accurately reflect the realities of financial markets. Consequently, VaR models can significantly underestimate the probability and magnitude of extreme, yet plausible, losses – the very events that pose the greatest threat to financial institutions. This limitation becomes especially pronounced in portfolios containing complex instruments or exposed to non-linear risks, prompting a search for more sophisticated risk measures capable of addressing these vulnerabilities and providing a more complete picture of potential downside exposure.
Value at Risk (VaR), while widely implemented, frequently relies on statistical assumptions – notably the presumption of normal distributions and linear relationships within financial models – that can significantly underestimate risk in complex portfolios. This simplification fails to adequately capture the ‘fat tails’ inherent in many financial time series, meaning extreme events occur with greater frequency than a normal distribution predicts. Consequently, VaR calculations often present an overly optimistic view of potential losses, leading financial institutions to allocate insufficient capital reserves. The model’s linear approximations further exacerbate this issue by failing to account for non-linear exposures, such as those arising from options or complex derivatives. This underestimation isn’t merely a theoretical concern; it directly impacts an organization’s ability to withstand unexpected market shocks and maintain solvency, highlighting the need for more sophisticated risk assessment techniques.
Recognizing the deficiencies of Value at Risk (VaR), current research prioritizes the development of alternative risk measures capable of more accurately depicting the full spectrum of potential losses. These advanced methodologies move beyond reliance on simplified statistical assumptions, such as normality, and instead focus on capturing the true shape of the loss distribution – including its “tails” which represent extreme, but plausible, events. Techniques like Expected Shortfall (ES), also known as Conditional Value at Risk (CVaR), and stress testing are gaining prominence, as they quantify the expected loss given that a certain threshold is exceeded, offering a more conservative and comprehensive view of downside risk. Furthermore, sophisticated modeling approaches incorporating historical simulation, Monte Carlo simulation, and extreme value theory are being employed to better understand the frequency and severity of losses, leading to more robust capital allocation and risk management strategies.
Conventional risk assessment techniques frequently treat the frequency of potential losses and the severity of those losses as independent variables, a simplification that obscures critical relationships within complex systems. This disconnect arises because many methods prioritize estimating the probability of an event occurring without fully accounting for how the magnitude of the loss changes as the probability shifts. A small number of extremely severe events, while infrequent, can dramatically impact overall portfolio risk-a contribution often underestimated by models focused on more common, less impactful losses. Consequently, a portfolio might appear adequately hedged against likely scenarios, yet remain vulnerable to catastrophic outcomes arising from the compounding effect of both high-severity and, even if rare, frequent events. The failure to capture this interplay demands more sophisticated approaches that model the entire loss distribution, not just its central tendencies.
Coherence as a Foundation: Beyond Simple Aggregation
Value at Risk (VaR), while widely used, lacks subadditivity, meaning the VaR of a portfolio can be greater than the sum of the VaRs of its individual components, violating a basic principle of coherent risk measurement. Coherent risk measures, such as Expected Shortfall (ES), also known as Conditional Value at Risk (CVaR), address this deficiency by satisfying four key axioms: monotonicity, subadditivity, positive homogeneity, and translation invariance. These properties ensure a logically consistent and mathematically sound framework for aggregating risks across portfolios and business units. Specifically, ES calculates the expected loss given that the loss exceeds the VaR threshold, providing a more conservative and comprehensive assessment of tail risk compared to VaR, which only identifies the threshold itself.
Coherent risk measures, unlike Value at Risk (VaR), adhere to specific mathematical axioms – namely, subadditivity, homogeneity, monotonicity, and translation invariance – which guarantee consistent and rational risk assessment. Subadditivity, $R(X+Y) \leq R(X) + R(Y)$, ensures that the risk of a combined portfolio is not greater than the sum of individual risks, preventing diversification being incorrectly penalized. Homogeneity dictates that scaling a portfolio by a positive constant scales the risk measure proportionally. Monotonicity states that if one portfolio dominates another (always yields higher returns), its risk measure must be lower. Translation invariance means that adding a constant to all returns does not change the risk measure. These properties collectively provide a more reliable foundation for capital allocation, regulatory compliance, and risk-based decision-making than measures lacking these characteristics.
Accurate estimation of the loss distribution is fundamental to the effective implementation of coherent risk measures like Expected Shortfall. Historical Simulation, a non-parametric approach, utilizes past returns to directly construct the empirical distribution of losses, requiring a sufficiently long and representative historical dataset. Monte Carlo Simulation, conversely, relies on generating numerous random scenarios based on specified statistical models for risk factors. This necessitates defining appropriate probability distributions and correlation structures, with techniques like the Multivariate Gaussian Copula frequently employed to model dependencies between variables. The choice between these techniques, or a combination thereof, depends on the availability of data, computational resources, and the complexity of the portfolio and its underlying risk factors. Both methods aim to provide a comprehensive representation of potential losses, enabling a robust quantification of risk.
Monte Carlo Simulations frequently utilize the Multivariate Gaussian Copula as a statistical tool to model the dependence structure between multiple risk factors. This allows for the generation of correlated random variables, crucial for accurately simulating portfolio losses under various market conditions. The copula separates the marginal distributions of individual risk factors from their dependence structure, enabling flexibility in modeling non-normal distributions and complex correlation patterns. Specifically, the Multivariate Gaussian Copula assumes that the correlation between risk factors can be represented by a correlation matrix, and transforms uniformly distributed random variables into correlated variables with the desired correlation structure. This approach is particularly useful when analytical solutions for portfolio loss distributions are unavailable, providing a robust method for estimating Value at Risk (VaR) and Expected Shortfall (ES).
Refining the Approximation: Discretization and the Essence of Loss
Quantization techniques address the computational challenges of working with continuous probability distributions by representing them with a finite set of discrete points. This discretization reduces the complexity of calculations, particularly in risk management where integrals and complex summations are common. Methods like Optimal Transport (OT) provide a mathematically rigorous framework for determining the best discrete approximation of a continuous distribution, minimizing the distance between the two while preserving key characteristics. The core principle of OT involves defining a cost function that quantifies the “distance” between probability mass in the continuous and discrete distributions, and then solving an optimization problem to find the most efficient mapping of mass. This allows for a trade-off between accuracy and computational speed, enabling the practical application of complex risk models.
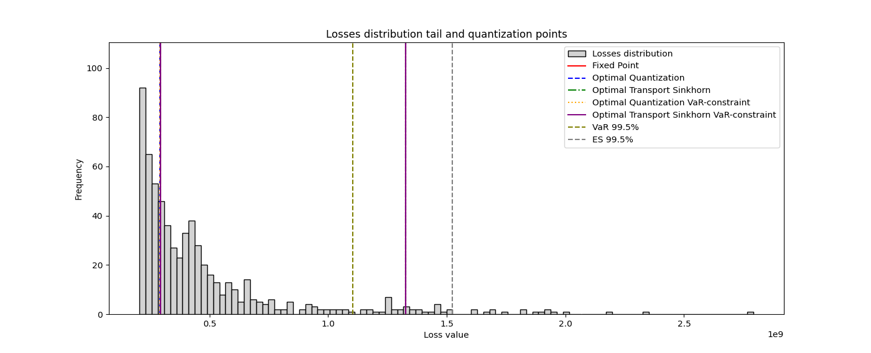
The Three-Point Distribution models the loss distribution by discretizing it into three distinct points: $m_0$ representing zero loss, $m_1$ representing moderate loss, and $m_2$ representing extreme loss. These points are associated with corresponding probabilities $p_0$, $p_1$, and $p_2$, where $p_0 + p_1 + p_2 = 1$. This simplification allows for a tractable representation of the loss distribution, capturing the essential characteristics without requiring the computational resources of more complex models. The probabilities are determined based on historical data or expert estimations, reflecting the likelihood of each loss scenario. By focusing on these three key points, the distribution provides a practical method for risk assessment and scenario analysis, especially when combined with the Magnitude-Propensity Approach.
The Three-Point Distribution facilitates a streamlined calculation of risk within the Magnitude-Propensity Approach by directly providing the necessary parameters for loss estimation. This approach defines risk as the expected loss, calculated as the sum of the product of loss magnitudes and their associated propensities. Utilizing the Three-Point Distribution – encompassing zero loss ($m_0$), moderate loss ($m_1$), and extreme loss ($m_2$) – allows for a reduction in computational complexity as it replaces continuous distribution modeling with discrete values. The expected loss is then calculated as $E[Loss] = p_0 m_0 + p_1 m_1 + p_2 * m_2$, where $p_i$ represents the propensity of each loss magnitude. This simplification allows for efficient risk assessment without requiring complex integrations or simulations often associated with continuous distributions.
The Three-Point Distribution offers a contrasting viewpoint to traditional risk measures like Value at Risk (VaR) and Expected Shortfall (ES) by explicitly modeling extreme loss scenarios. Analysis utilizing this distribution can reveal inconsistencies where existing methods underestimate potential losses. Specifically, the Three-Point Distribution ensures that the modeled extreme loss, denoted as $m_2$, is demonstrably greater than or equal to the VaR at the same confidence level. This constraint addresses a limitation of VaR and ES, which may not fully capture the magnitude of tail risk, and provides a more conservative, and potentially more accurate, assessment of downside exposure. The $m_2$ parameter represents the loss experienced in extreme, but plausible, scenarios, ensuring it’s never less than the VaR threshold.
Beyond the Formula: Analytical Foundations and the Limits of Differentiation
Derivatives are foundational tools in modern risk management, enabling the quantification of sensitivity to underlying market factors; however, traditional derivative calculations can face limitations when dealing with non-smooth or complex portfolios. B-Derivatives offer an alternative analytical approach, leveraging a function, $H$, to extend the concept of differentiation to a broader class of functions. This function, $H$, effectively smooths out irregularities, allowing for the consistent calculation of derivatives even in situations where standard methods fail. By employing B-Differentiability, analysts gain a more robust and reliable assessment of portfolio risk, capturing sensitivities that might otherwise be missed, and ultimately improving the accuracy of risk models.
The reliability of risk calculations, particularly those employing B-Derivatives, hinges fundamentally on establishing B-Differentiability. This concept extends traditional differentiability to encompass a broader class of functions frequently encountered in financial modeling, ensuring calculations aren’t unduly sensitive to minor input variations. Demonstrating B-Differentiability means verifying that the derivative, as defined within the B-Derivative framework, exists and is well-behaved – essentially, that small changes in portfolio parameters yield predictable and consistent changes in risk measures. Without this property, calculations can produce unstable or misleading results, potentially underestimating exposure or failing to accurately capture the nuances of complex financial instruments. Consequently, rigorous verification of B-Differentiability is not merely a mathematical formality, but a crucial step in building robust and trustworthy risk management systems, safeguarding against potentially significant financial miscalculations.
A robust analytical framework, built upon the principles of B-Derivatives and the H function, offers a significant advancement in the accurate assessment and management of risk within complex investment portfolios. Traditional risk models often struggle with the intricacies of correlated assets and non-linear derivatives; however, this approach provides the mathematical tools to navigate these challenges with greater precision. By establishing a solid foundation for calculating sensitivities and understanding the interplay between various risk factors, portfolio managers can move beyond simple approximations and gain a more nuanced understanding of potential losses. This, in turn, facilitates more informed decision-making, allowing for the optimization of portfolio construction and the implementation of effective hedging strategies, ultimately contributing to enhanced stability and improved returns even under stressed market conditions. The framework’s strength lies in its ability to model uncertainty and provide a consistent methodology for evaluating risk across a diverse range of financial instruments.
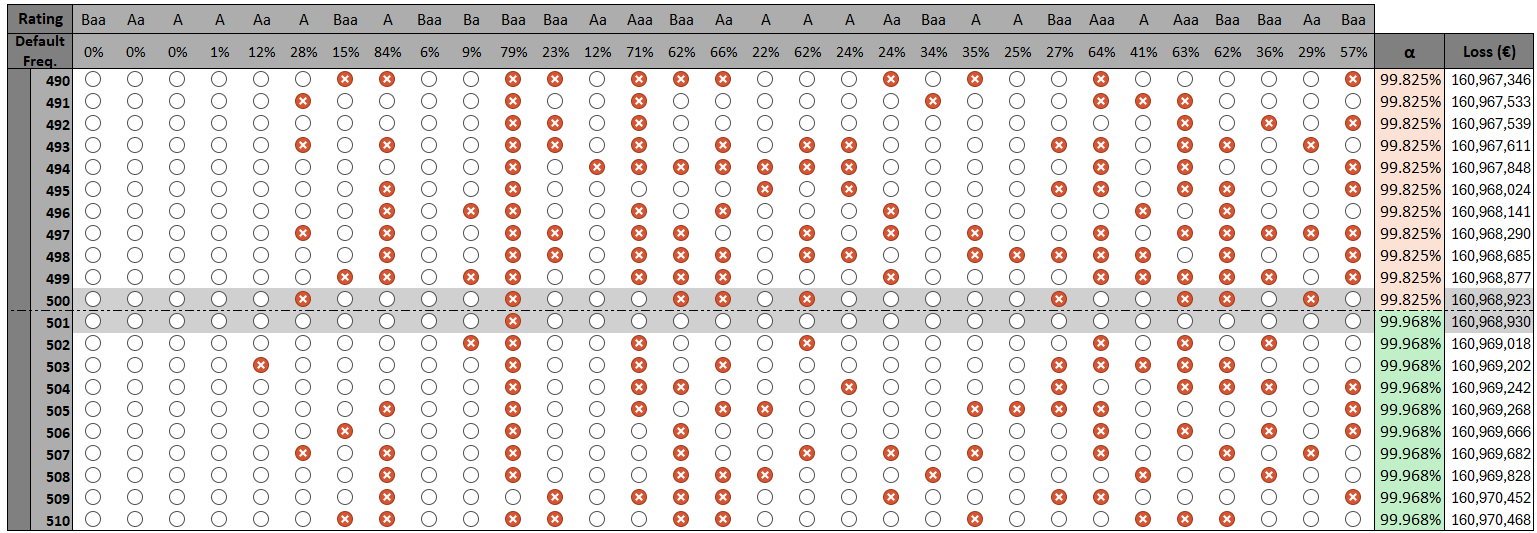
Within this analytical framework, the estimation of Default Risk Charge – effectively a one-year Value at Risk ($VaR$) – benefits significantly from the application of Monte Carlo Simulations. These simulations allow for the modeling of numerous potential default scenarios and their associated losses, providing a robust and statistically sound assessment of credit risk. Numerical procedures employed within the simulations consistently demonstrate convergence, meaning the results stabilize and become reliable as the number of simulations increases. Furthermore, these procedures exhibit excellent computational performance, allowing for efficient risk assessment even with complex portfolios and a large number of underlying credit exposures. This combination of accuracy, efficiency, and demonstrable convergence makes this approach a powerful tool for financial institutions seeking to quantify and manage their credit risk effectively.
Beyond the Model: Aligning Risk Measurement with Strategic Imperatives
A robust risk management program extends beyond the precision of its calculations and models; its true efficacy hinges on a deliberate connection to the organization’s fundamental priorities and boundaries. Simply identifying and quantifying potential threats is insufficient if those threats aren’t evaluated in the context of how much risk the organization is willing to accept – its risk appetite – and how much deviation from that appetite it can withstand – its risk tolerance. An organization with a high growth strategy, for instance, may exhibit a greater risk appetite than one focused on preservation of capital, necessitating different thresholds for acceptable losses. Consequently, risk measurement techniques must be calibrated to reflect these strategic preferences, ensuring that reported risk exposures are meaningful and actionable, and ultimately support, rather than hinder, the achievement of organizational goals.
The Frequency-Severity Framework offers a powerful approach to risk assessment by acknowledging that risk isn’t solely defined by the probability of an event, but also by the magnitude of its potential impact. This framework encourages organizations to move beyond simply counting how often something might occur, and instead consider the potential losses associated with each event. Risks can then be categorized based on both how frequently they materialize and the severity of their consequences – for instance, a high-frequency, low-severity risk might necessitate preventative controls, while a low-frequency, high-severity event demands robust contingency planning. By visually mapping risks across these two dimensions, decision-makers gain a nuanced understanding of their risk profile and can prioritize mitigation efforts based on a balanced assessment of both likelihood and impact, ultimately leading to more effective capital allocation and strategic resource management.
A truly effective risk management program transcends mere calculation; it necessitates the integration of advanced analytical techniques with a deep comprehension of an organization’s specific preferences and strategic objectives. While quantitative methods – such as Monte Carlo simulations, stress testing, and Value at Risk calculations – provide crucial insights into potential exposures, these tools are most powerful when calibrated to reflect the organization’s risk appetite and tolerance levels. This alignment ensures that identified risks are not simply measured, but prioritized and managed in a manner consistent with the organization’s overall strategy. Consequently, risk managers can move beyond reporting potential losses to providing actionable intelligence that supports informed decision-making and fosters a proactive risk culture, ultimately enhancing the organization’s resilience and long-term success.
Continued investigation into risk management methodologies must prioritize adaptability to both shifting regulatory requirements and the escalating sophistication of financial instruments. The current pace of innovation in areas like decentralized finance and algorithmic trading necessitates a proactive approach to model validation and refinement. Researchers should concentrate on developing dynamic risk assessment frameworks capable of incorporating real-time data and accounting for emergent risks not captured by traditional models. Furthermore, exploring the intersection of artificial intelligence and machine learning with regulatory compliance-specifically, how these technologies can automate reporting and enhance transparency-presents a crucial avenue for future study. Ultimately, ensuring the robustness and relevance of risk management practices requires a sustained commitment to integrating advanced analytical techniques with the evolving complexities of the financial world and the demands of regulatory oversight.
The pursuit of quantifying risk, as detailed in this proposal for a magnitude-propensity approach, inherently involves challenging established norms. One seeks not merely to calculate potential loss, but to understand the system of loss itself. This echoes Simone de Beauvoir’s assertion: “One is not born, but rather becomes, a woman.” Similarly, risk isn’t a pre-defined entity; it becomes apparent through observation and analysis-specifically, by deconstructing the frequency and severity of potential outcomes. The shift from scalar measures like Value-at-Risk to a three-point distribution isn’t simply a refinement of calculation; it’s an acknowledgement that reality rarely conforms to single-point estimations, demanding a more nuanced and adaptive understanding of the underlying mechanisms.
Uncharted Territory
The pursuit of risk quantification, as demonstrated by this work, inevitably bumps against the limitations of any chosen abstraction. Shifting from scalar summaries – those neat, easily digestible numbers – to a three-point distribution is a step toward acknowledging the inherent messiness of financial loss, but it is not a destination. The real challenge lies not in refining the description of risk, but in understanding why those discrete states – zero, moderate, extreme – appear with the observed frequencies. The mechanism generating these losses remains, for the most part, a black box.
Future work should therefore prioritize reverse-engineering this generative process. Optimal transport and quantization, while powerful tools for characterizing the distribution, are ultimately descriptive. A deeper investigation into the underlying dependencies – the subtle correlations between derivative exposures and systemic events – might reveal predictive signals currently obscured by the aggregation inherent in frequency-severity models. Monte Carlo simulation, currently used for calibration, could become a tool for hypothesis testing, probing the structural assumptions of the three-point framework.
The temptation, of course, is to build ever-more-complex models, chasing the illusion of perfect prediction. A more fruitful path may lie in accepting the irreducible uncertainty, and focusing on the robustness of decision-making under that uncertainty. This requires not simply quantifying the possible, but actively seeking out the limits of the model, deliberately stressing the system to reveal its hidden vulnerabilities. After all, the most valuable insights often emerge from the cracks.
Original article: https://arxiv.org/pdf/2511.21556.pdf
Contact the author: https://www.linkedin.com/in/avetisyan/
See also:
- United Airlines can now kick passengers off flights and ban them for not using headphones
- Crimson Desert: Disconnected Truth Puzzle Guide
- All 9 Coalition Heroes In Invincible Season 4 & Their Powers
- Mewgenics vinyl limited editions now available to pre-order
- Invincible Season 4 Episode 6 Release Date, Time, Where to Watch
- Assassin’s Creed Shadows will get upgraded PSSR support on PS5 Pro with Title Update 1.1.9 launching April 7
- The Boys Season 5 Spoilers: Every Major Character Death If the Show Follows the Comics
- Grok’s ‘Ask’ feature no longer free as X moves it behind paywall
- Grey’s Anatomy Season 23 Confirmed for 2026-2027 Broadcast Season
- Does Mark survive Invincible vs Conquest 2? Comics reveal fate after S4E5
2025-11-28 05:05