Author: Denis Avetisyan
New research demonstrates that machine learning models are significantly improving the accuracy of volatility forecasts, challenging established econometric methods.
This review finds that random forests and neural networks consistently outperform traditional HAR models, particularly with high-dimensional data and extended forecast horizons.
Accurately forecasting financial volatility remains a persistent challenge despite decades of research. This is addressed in ‘A machine learning approach to volatility forecasting’, which investigates the performance of various machine learning algorithms against traditional Heterogeneous AutoRegressive (HAR) models in predicting realized variance of the Dow Jones Industrial Average. The study demonstrates that machine learning techniques, even with minimal hyperparameter tuning, outperform HAR models, particularly at longer forecast horizons and when leveraging a greater number of predictors. Could these findings signal a shift towards data-driven, nonlinear approaches for more robust volatility forecasting and improved risk management?
Deciphering Market Fluctuations: The Foundation of Volatility Prediction
The accurate prediction of market volatility remains a cornerstone of modern finance, directly influencing decisions regarding portfolio risk and the valuation of financial instruments. However, conventional forecasting techniques, frequently relying on historical averages or simplified models, often struggle to adequately represent the intricate and ever-changing nature of financial markets. These limitations stem from the inherent complexities – non-linear relationships, abrupt shifts, and the influence of unpredictable events – that characterize price fluctuations. Consequently, a reliance on these traditional methods can lead to underestimated risk exposures, mispriced assets, and ultimately, suboptimal investment outcomes, driving the need for more sophisticated analytical approaches capable of capturing the full spectrum of market dynamics.
The advent of high-frequency data-records of asset prices taken at intervals of seconds or even milliseconds-has revolutionized the ability to quantify market volatility. Previously, volatility was largely estimated using daily price changes, smoothing over much of the intraday fluctuation. Now, by analyzing these granular datasets, researchers can compute metrics like Realized Variance
The predictive power of financial models hinges on accurately characterizing the behavior of time series data, and a critical, often overlooked, property is that of long memory. Unlike processes where past events have only a short-lived impact, financial time series frequently exhibit correlations stretching far into the past – meaning that shocks and trends can persist for extended periods. This long memory effect violates assumptions of many traditional statistical models, leading to underestimation of risk and inaccurate forecasts. Capturing this persistence requires specialized techniques, such as fractional integration or the use of long-memory models like the ARFIMA (Autoregressive Fractionally Integrated Moving Average) process. Ignoring long memory can result in models that fail to account for the full range of possible future outcomes, while its proper incorporation significantly enhances the robustness and reliability of volatility predictions, ultimately improving risk management and investment strategies.
Establishing a Benchmark: The HAR Model and Linear Approaches
The Heterogeneous Autoregressive (HAR) model is a widely used benchmark in volatility forecasting due to its simplicity and ability to capture the long-memory property of volatility. It predicts future volatility as a weighted sum of past realized variance, specifically utilizing daily, weekly, and monthly components. The model’s core principle rests on the observation that shocks to volatility persist over different time horizons; recent shocks have a greater immediate impact, while older shocks contribute to a lower, but still relevant, level of persistent volatility. Realized Variance, calculated as the sum of squared intraday returns, provides a proxy for the true, unobservable volatility and serves as the primary input for the HAR model. The standard HAR specification uses a linear combination of these lagged realized variance measures to generate a forecast for the variance in the next period.
LogHAR models represent a refinement of the Heterogeneous Autoregressive (HAR) model by applying logarithmic transformations to the realized variance components used as predictors. This transformation, typically applied to lagged realized variance values before their inclusion in the regression, aims to stabilize the variance and address potential heteroscedasticity in the data. The logarithmic transformation can improve predictive accuracy by reducing the impact of extreme values and potentially linearizing the relationship between lagged variance and future volatility. While the specific implementation varies, the LogHAR model consistently demonstrates performance comparable to, and in some cases exceeding, the standard HAR model in volatility forecasting exercises.
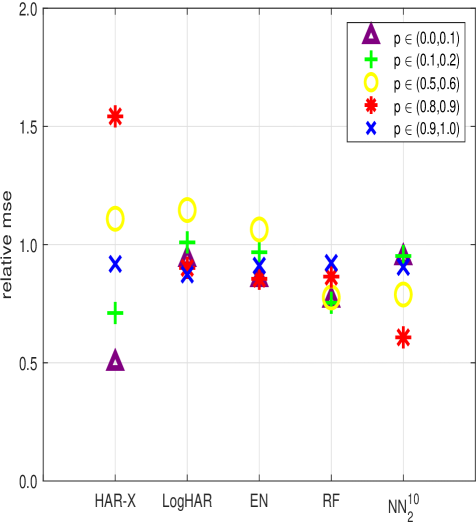
Linear regression models, specifically Ridge Regression, Lasso Regression, and Elastic Net, are applicable to volatility modeling; however, their performance is limited by susceptibility to overfitting, necessitating careful regularization parameter selection. Comparative analyses demonstrate that these linear approaches are consistently outperformed by more complex machine learning techniques. At one-day-ahead forecast horizons, tree-based models and neural networks achieve a relative Mean Squared Error (MSE) improvement of up to 20% compared to the optimized linear regression counterparts, indicating a substantial gain in predictive accuracy.
Transcending Linearity: Machine Learning for Volatility Forecasting
Random Forest is an ensemble learning technique that constructs a multitude of decision trees during training. Each tree is built on a random subset of the training data and a random selection of features, introducing diversity into the model. Predictions are generated by averaging the predictions of all individual trees. This averaging process reduces overfitting and improves generalization performance, enabling the model to capture non-linear relationships present in volatility data that simpler models may miss. The method’s inherent ability to handle high-dimensional data and its robustness to outliers make it particularly suitable for modeling the complex dynamics of financial time series.
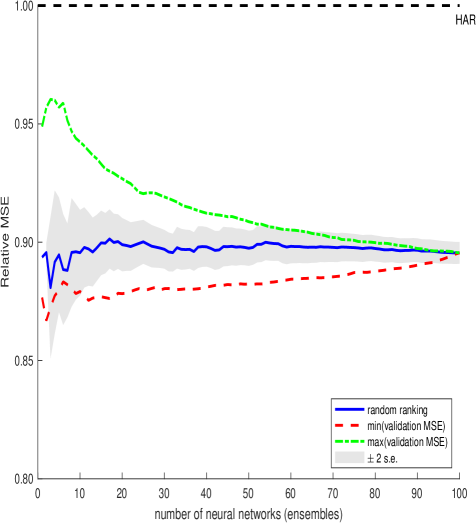
Neural Networks, distinguished by their interconnected nodes arranged in layers, possess a capacity for modeling non-linear relationships in volatility data exceeding that of simpler models. However, realizing this potential necessitates meticulous hyperparameter optimization. Techniques such as Adaptive Learning Rate dynamically adjust the weighting applied to updates during the training process, preventing oscillation and accelerating convergence. Dropout, a regularization method, randomly deactivates neurons during training, mitigating overfitting and improving generalization performance on unseen data. Successful implementation of these tuning methods is critical to preventing the network from memorizing the training data and ensuring robust predictive capabilities.
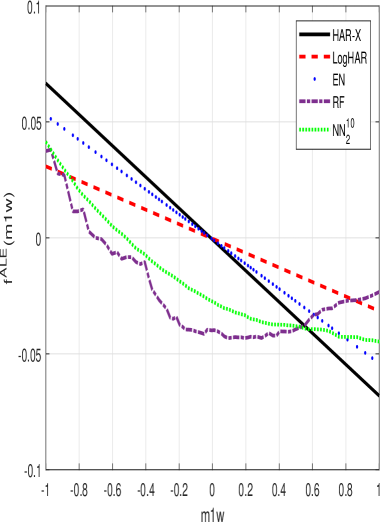
Interpreting the predictions of complex machine learning models used for volatility forecasting requires understanding feature importance. Methods like Accumulated Local Effect (ALE) quantify the marginal effect of each input feature on the model’s output, providing insights into which factors drive predictions. Empirical results demonstrate that these machine learning approaches consistently outperform traditional Heterogeneous Autoregressive (HAR) models in volatility forecasting. Specifically, at one-month forecast horizons, these models achieve up to a 40% reduction in Mean Squared Error (MSE), indicating a substantial improvement in predictive accuracy compared to benchmark methods.
Traditional volatility models often struggle to accurately forecast volatility beyond short time horizons due to an inability to capture long-memory processes. Recent machine learning approaches, however, exhibit demonstrably improved performance in this area. Analysis of forecast error autocorrelation reveals that these models generate significantly higher autocorrelation at longer horizons compared to traditional Heterogeneous Autoregressive (HAR) models. This indicates that the machine learning models are more effectively retaining information about past volatility shocks and incorporating them into future predictions, thereby better representing the persistent nature of volatility observed in financial time series. The increased autocorrelation is a key metric supporting the claim that these models are superior in capturing and forecasting long-memory structure in volatility.
Beyond Variance: Capturing the Full Distribution of Market Risk
Traditional measures of market volatility often rely on realized variance, which captures the spread of returns. However, a complete understanding of market fluctuations requires looking beyond this basic metric. Realized quarticity, for instance, assesses the “peakedness” or “tailedness” of the return distribution, revealing information about extreme events and the likelihood of large price swings not captured by variance alone. By incorporating these higher-order moments – skewness and kurtosis, reflected in quarticity – analysts gain a more nuanced picture of risk. This expanded view allows for the identification of patterns indicative of potentially severe market moves, providing a richer dataset for modeling and a more comprehensive assessment of the true range of possible outcomes than relying solely on the average dispersion of returns.
Contemporary financial modeling frequently relies on variance as the primary metric for quantifying market risk, but incorporating higher-order moments – such as skewness and kurtosis, captured through measures like realized quarticity – offers a pathway to more nuanced and potentially more accurate forecasts. Existing volatility models, traditionally focused on first and second moments, can be augmented to leverage these advanced statistical descriptors of asset returns. This integration isn’t merely about adding complexity; it’s about capturing the ‘fat tails’ and asymmetries inherent in financial data, which standard models often underestimate. By better characterizing the full distribution of potential outcomes, these refined models aim to improve the precision of forecasting, leading to more reliable risk assessments and, ultimately, more informed investment strategies. The ability to anticipate extreme events – those beyond the scope of typical normal distributions – is a critical benefit of this approach, offering a more complete picture of potential portfolio exposures.
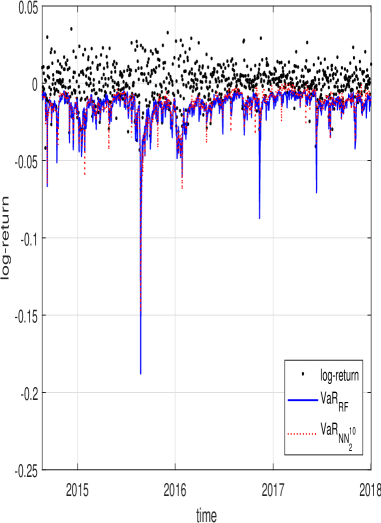
Improved volatility forecasting directly translates to more reliable Value at Risk (VaR) estimations, offering a crucial benefit for investment strategies. Recent analyses demonstrate that while machine learning models did contribute to a reduction in potential losses as measured by VaR, this improvement lacked strong statistical significance. Conversely, these models achieved a notably substantial reduction in Mean Squared Error (MSE), indicating a significant enhancement in the accuracy of volatility predictions themselves. This suggests that the primary benefit of advanced forecasting techniques lies not necessarily in dramatically altering VaR figures, but in providing a more precise understanding of market risk, ultimately empowering more informed and strategic investment decisions based on a clearer picture of potential fluctuations.
The pursuit of accurate volatility forecasting, as detailed in this work, demands a rigorous skepticism of established methods. While traditional HAR models offer a baseline, the demonstrated superiority of machine learning techniques – random forests and neural networks – underscores the necessity of continuous refinement. This isn’t simply about achieving marginally better results; it’s about acknowledging the inherent limitations of any single model. As Francis Bacon observed, “Truth emerges more readily from error than from confusion.” A hypothesis isn’t belief – it’s structured doubt, and the consistent outperformance of these newer methods, particularly with extended forecast horizons, compels a re-evaluation of conventional wisdom. Anything confirming expectations needs a second look; the study’s findings illustrate the danger of prematurely accepting established paradigms in financial modeling.
What Remains Unknown?
The demonstrated capacity of machine learning to eclipse established volatility forecasting methods, while statistically notable, does not resolve the underlying conceptual difficulties. Superior predictive power, particularly when leveraging extensive predictor sets, merely shifts the focus. The question is not simply if models can forecast, but why they succeed. Correlation, as always, remains suspicion, not proof of mechanistic understanding. The “black box” nature of complex algorithms offers little insight into the true drivers of market volatility, hindering the development of robust, theoretically grounded models.
Future work must confront the issue of out-of-sample generalization. Performance gains achieved through extensive regularization and predictor selection may prove fragile in the face of unforeseen market regimes. A critical avenue for exploration lies in incorporating economic intuition and constraint into model architectures, moving beyond purely data-driven approaches. The field requires not simply more accurate forecasts, but models that exhibit a degree of rationality – the capacity to degrade gracefully, rather than fail catastrophically, when confronted with novel circumstances.
Ultimately, the pursuit of volatility forecasting should not be viewed as an exercise in perfect prediction, but as a continuous refinement of understanding. Each marginal improvement, each failed hypothesis, brings the field closer to acknowledging the inherent limits of predictability in complex systems. The real value lies not in eliminating uncertainty, but in quantifying it with increasing precision and acknowledging the inevitable surprises.
Original article: https://arxiv.org/pdf/2601.13014.pdf
Contact the author: https://www.linkedin.com/in/avetisyan/
See also:
- United Airlines can now kick passengers off flights and ban them for not using headphones
- Gold Rate Forecast
- How to Solve the Glenbright Manor Puzzle in Crimson Desert
- 8 Actors Who Could Play Blackbeard In One Piece Live-Action Season 3
- All Golden Ball Locations in Yakuza Kiwami 3 & Dark Ties
- How to Get to the Undercoast in Esoteric Ebb
- How to Complete Bloom of Tranquility Challenge in Infinity Nikki
- $2B AI cow collars use “cowgorithm” to herd cattle with no fences
- Binance’s Bold Bitcoin Bet: $1B SAFU Fund Dives Into Crypto’s Deep End
- All MLB The Show 26 Quirks & What They Do
2026-01-22 04:58