Over the last hour, bitcoin’s been priced at $110,901 to $111,336 as of Oct. 14, 2025, reflecting continued volatility in a consolidating downtrend. With a market capitalization of $2.21 trillion and a 24-hour trading volume of $75.97 billion, the digital asset moved within an intraday range of $110,256 to $115,934.
Bitcoin
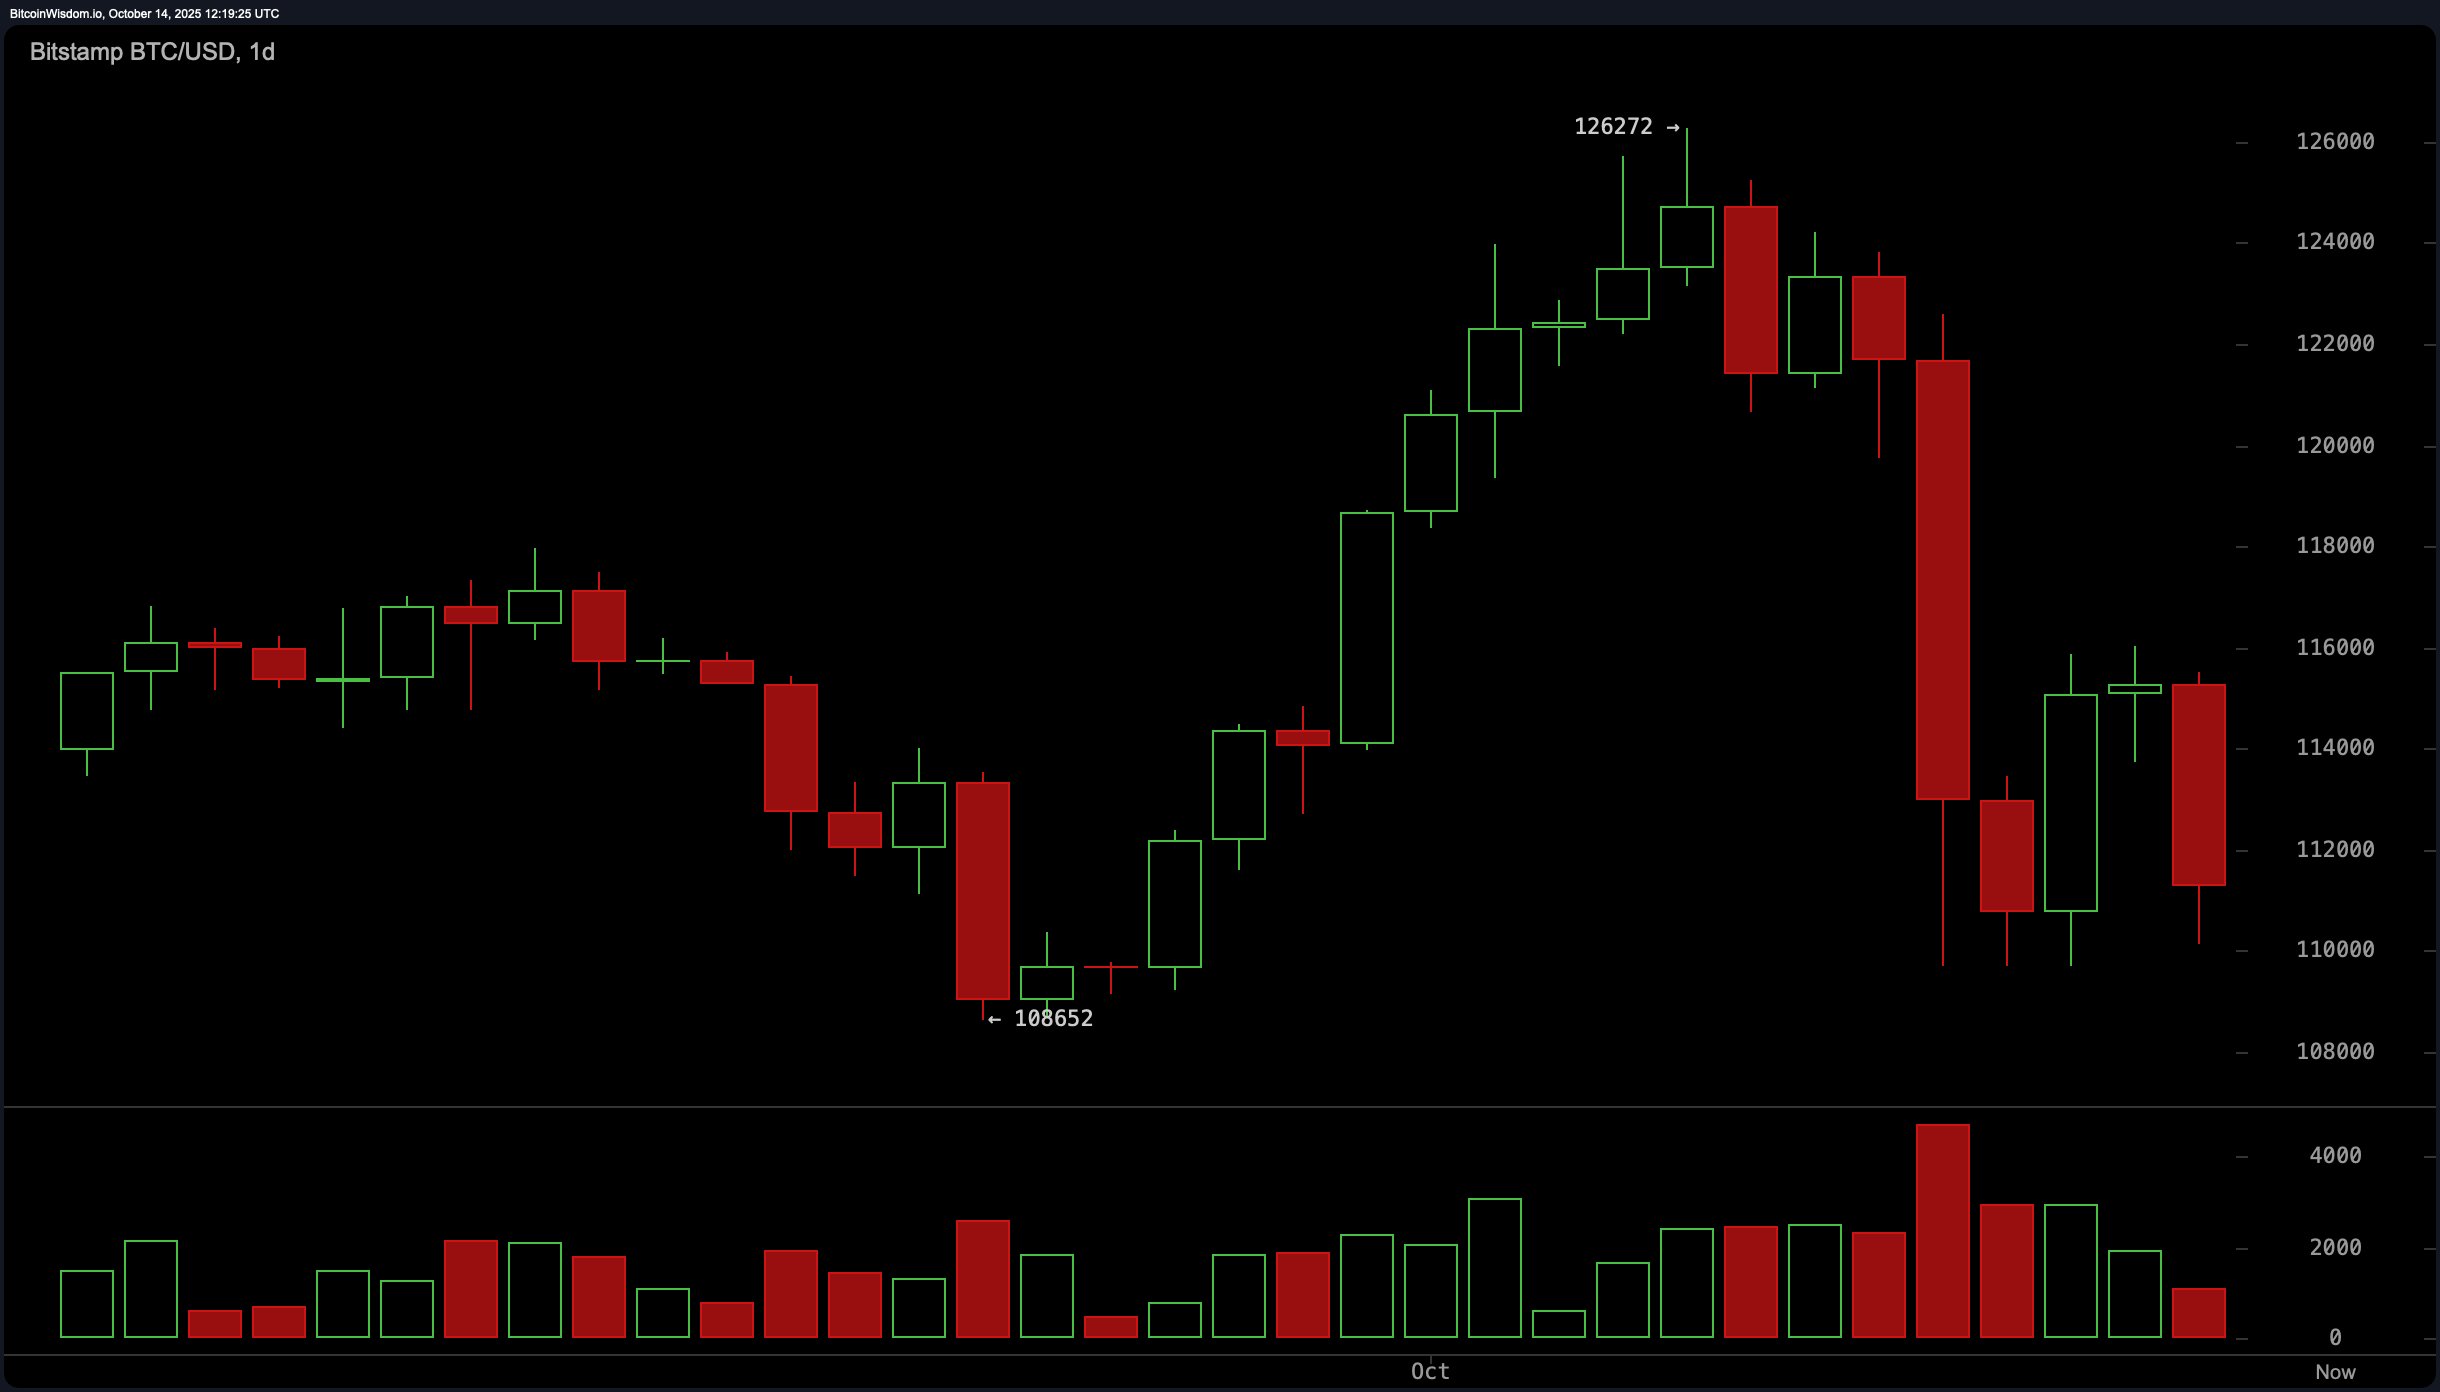
The daily chart shows that bitcoin experienced a sharp pullback from a recent high near $126,272, following a rally off the local bottom at approximately $108,652. Heavy selling pressure, marked by large red candles and volume spikes during the decline, suggests strong bearish conviction. 🧠💸
The price is currently consolidating between $110,000 and $116,000, with indications of a potential bear flag. For bullish momentum to resume, the price would need to decisively break above the $117,000-$118,000 level on substantial volume. Until then, the structure favors continuation to the downside, especially if $108,500 is breached. 🕳️📉
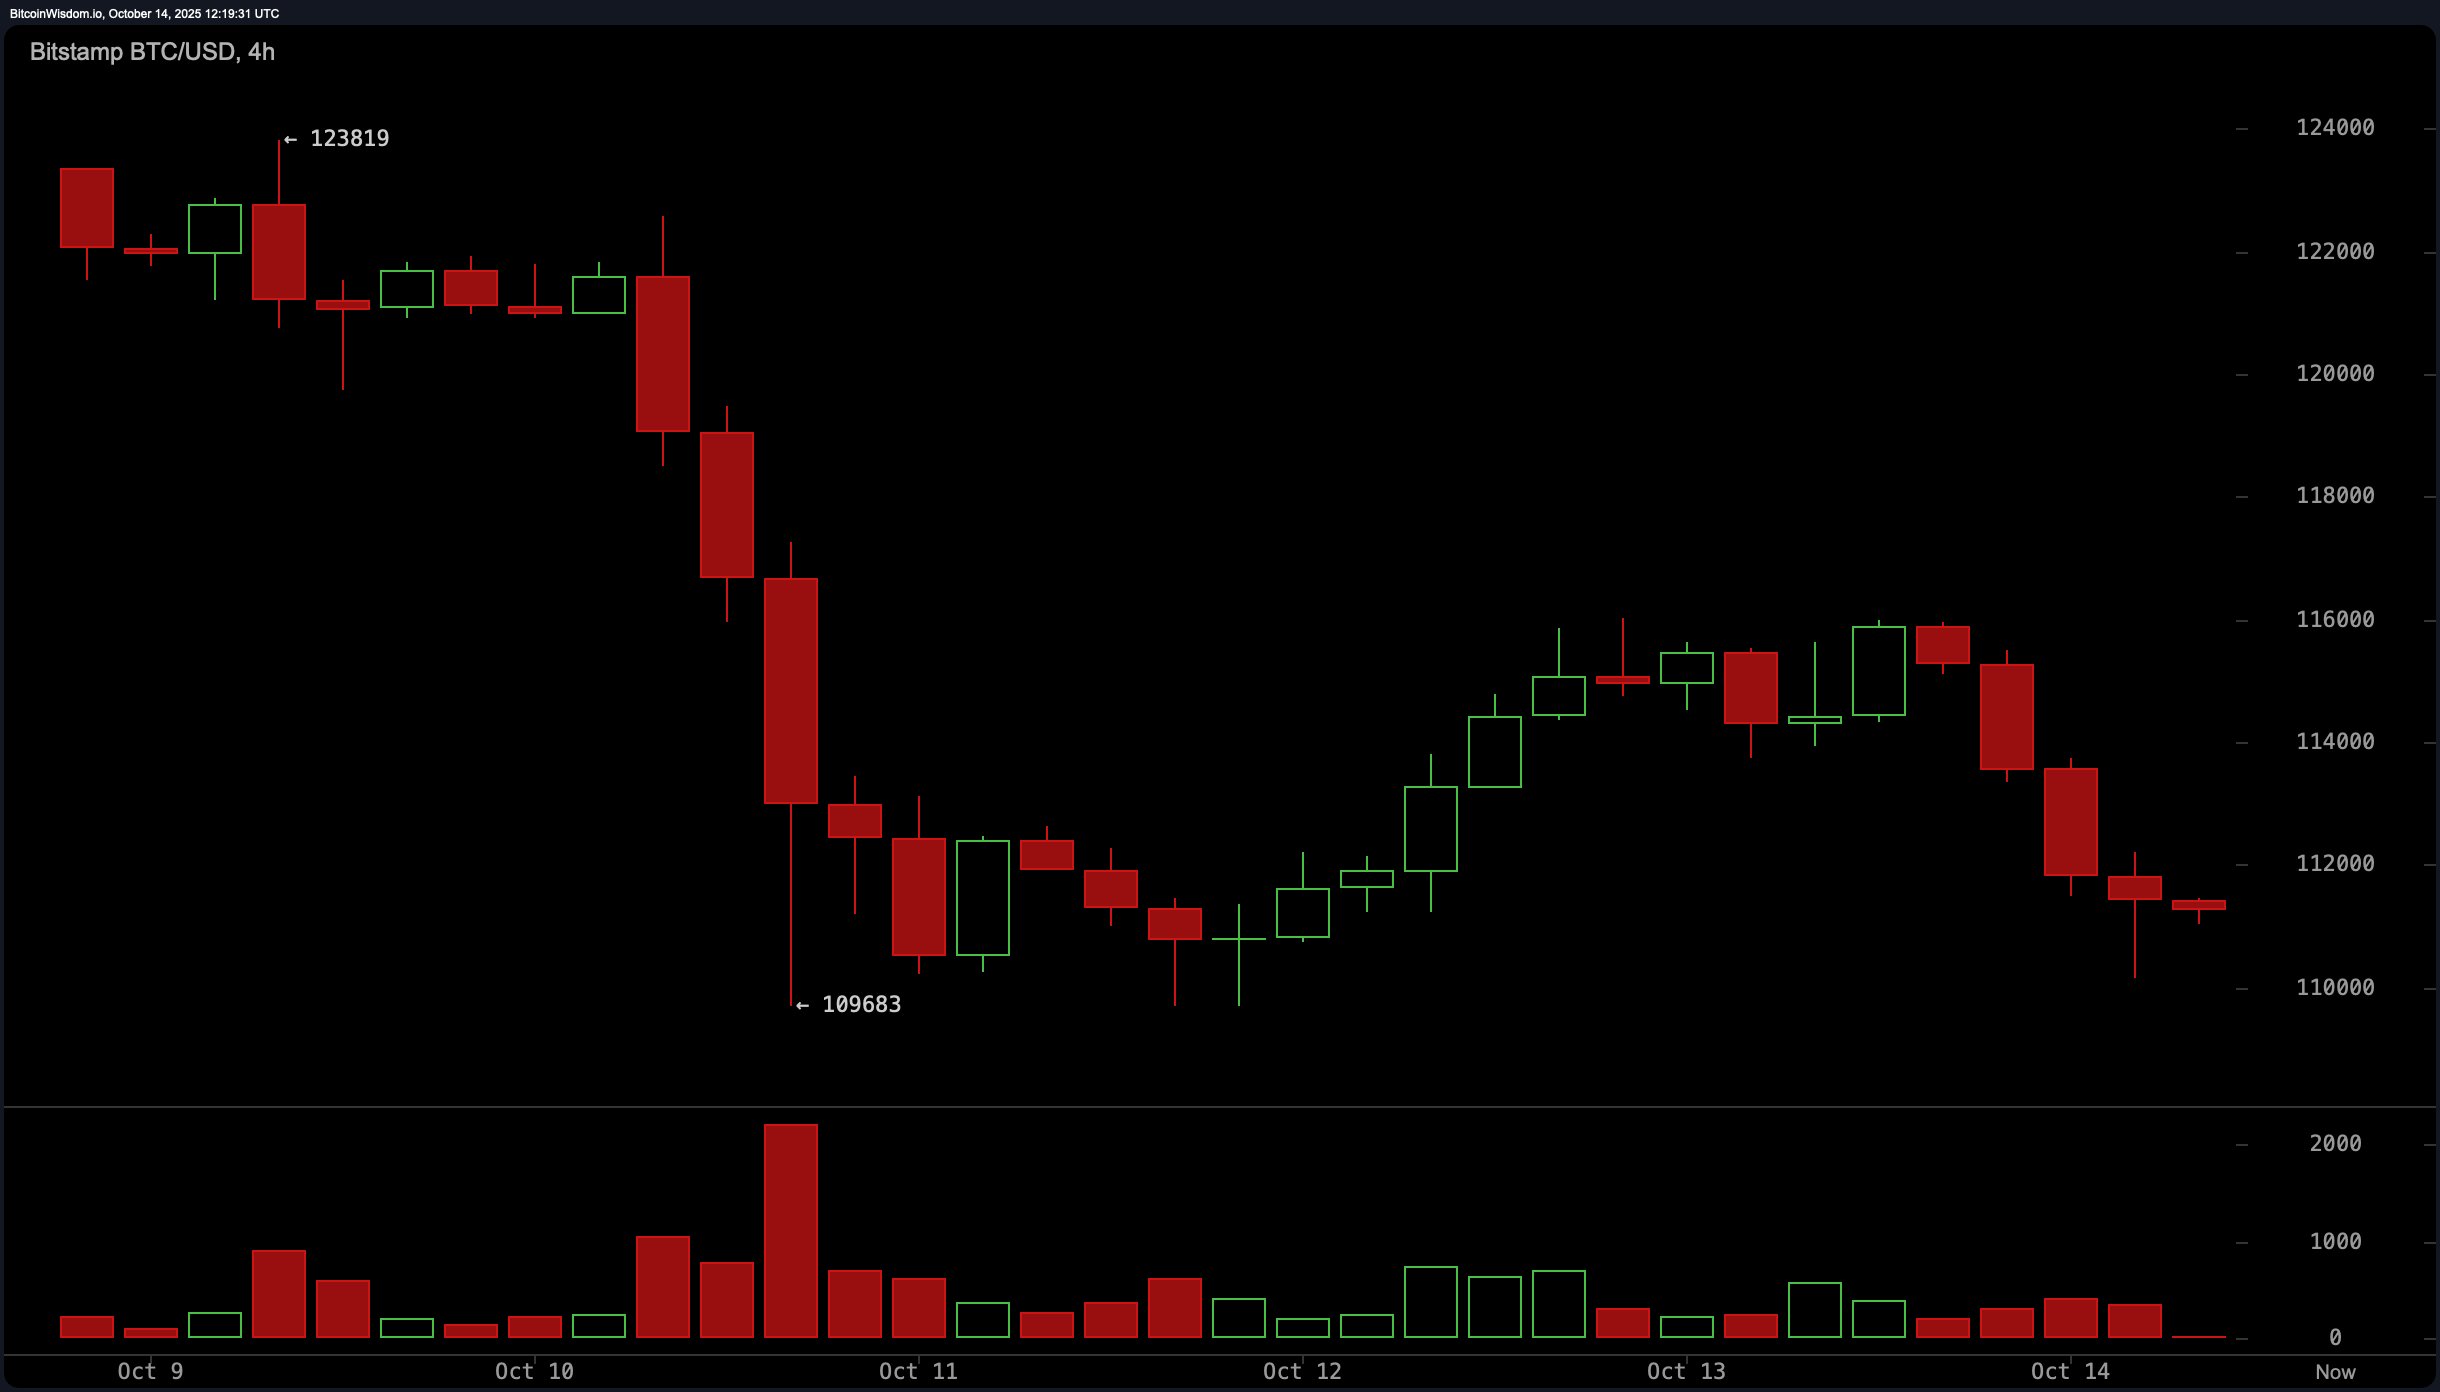
On the 4-hour bitcoin chart, the short-term trend remains bearish, with a local top at $123,819 and a recent bottom at $109,683. The formation of lower highs and weakening bounce attempts suggests a descending triangle pattern. Volume has thinned out, reflecting a lack of buying interest. The key area of resistance is seen between $114,000 and $115,000, where rejections have previously occurred. If momentum picks up above $116,000, it could invalidate the bearish structure, but currently, pressure favors downside retests of previous lows. 🐻💣
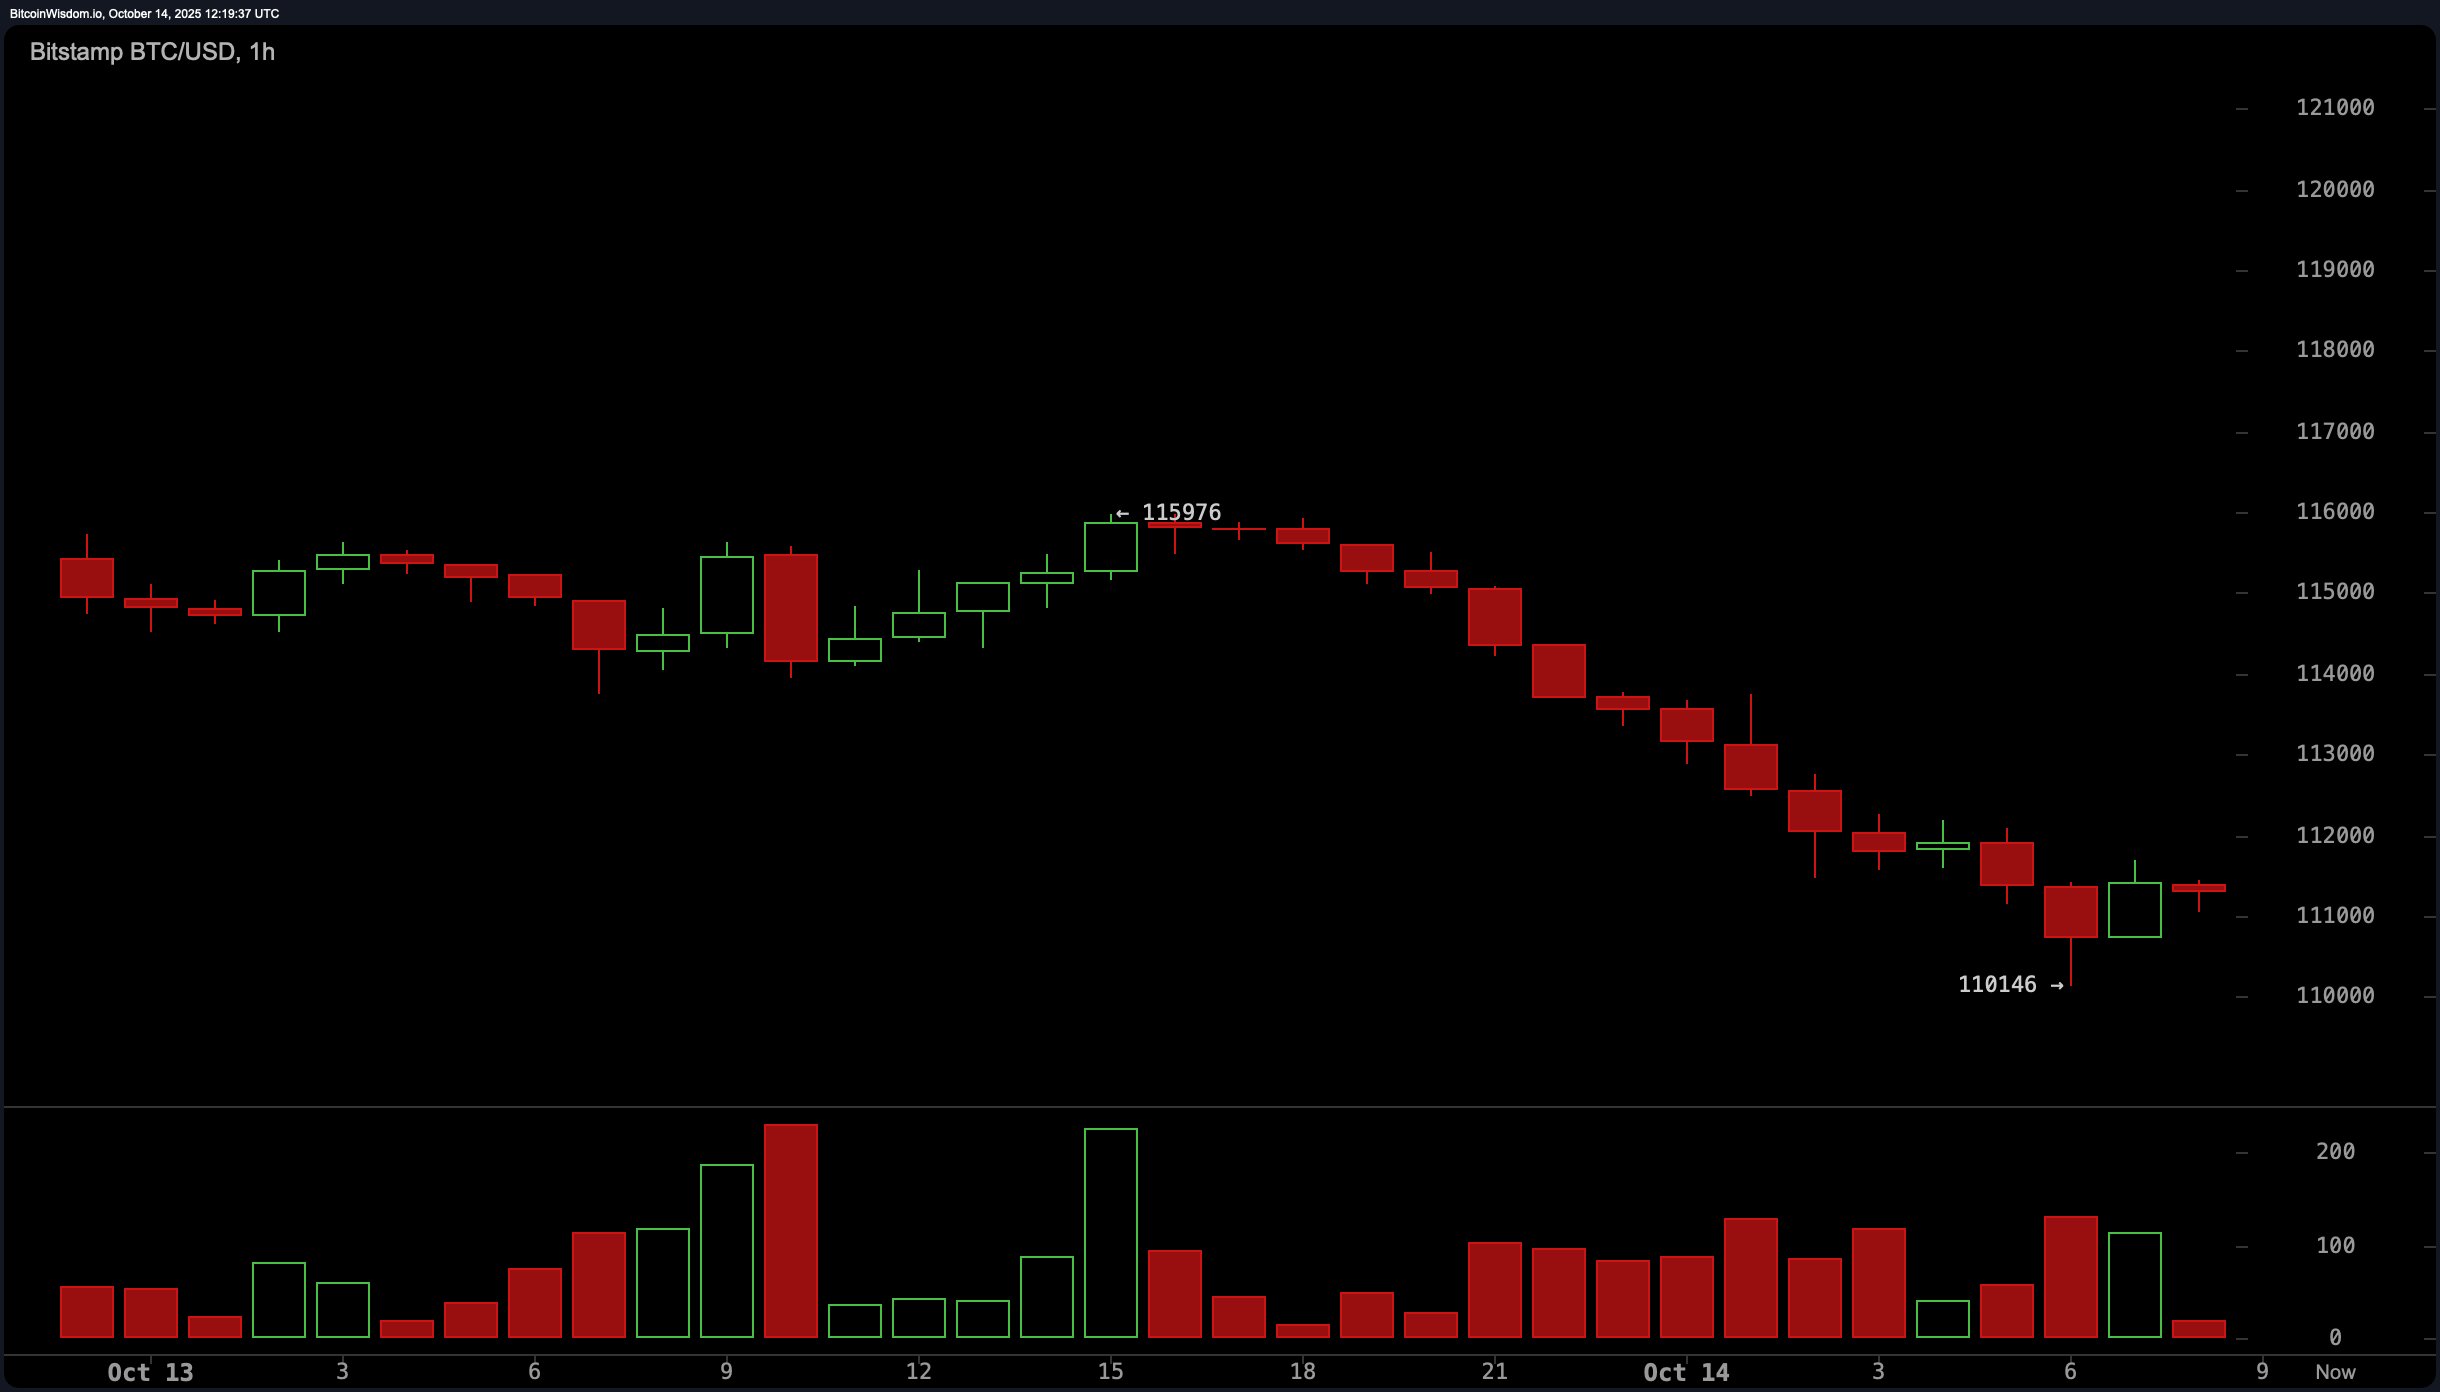
The 1-hour bitcoin chart reinforces the bearish outlook with a clear pattern of lower highs and lower lows, consistent with a downtrend. The most recent swing low was recorded at $110,146, and price action remains capped below $112,000. Candlestick structures are showing indecision, and declining volume indicates a probable continuation of the current trend. A short-term recovery would require a break above $113,000 per bitcoin, accompanied by strong volume. However, until that occurs, the bias remains towards lower levels, with intraday targets near $110,200. 🧠📉
Technical oscillators on the daily timeframe present a mostly neutral stance. The relative strength index (RSI) stands at 41, suggesting neither overbought nor oversold conditions. The stochastic oscillator reads 25, and the commodity channel index (CCI) is at −61, both reflecting consolidation near support zones. The average directional index (ADX) at 25 indicates a moderate trend strength without signaling a directional shift. The awesome oscillator displays a value of −2,378, showing lingering bearish momentum. Notably, the momentum indicator at −11,275 and the moving average convergence divergence (MACD) at −59 both show continued downside pressure. 🧠💸
A review of moving averages (MAs) across multiple timeframes reveals that bitcoin is trading below nearly all key short- and mid-term moving averages. The 10-day exponential moving average (EMA) and 10-day simple moving average (SMA) are positioned at $115,901 and $117,996, respectively. Similarly, 20-, 30-, 50-, and 100-day EMAs and SMAs are all higher than the current price. This alignment supports the prevailing downtrend. However, the 200-day EMA and 200-day SMA, located at $108,045 and $107,129, respectively, are still beneath the current price, providing potential longer-term support zones. 🕳️📉
//markets.bitcoin.com/crypto/bitcoin”>bitcoin
remains under pressure, with no confirmed signs of a reversal. While minor relief rallies may occur, broader trend signals and momentum indicators continue to lean bearish. Traders are advised to monitor the $108,500 and $117,000 levels closely for any breakout or breakdown confirmations. 🧠💸
Bull Verdict:
If bitcoin can reclaim the $117,000-$118,000 resistance range with high volume and sustained momentum, the recent consolidation could resolve into a renewed uptrend. Confirmation above these levels would invalidate the current bearish structure and potentially open the path toward retesting prior highs near $126,000. 🚀📈
Bear Verdict:
As long as bitcoin remains below $112,000 on the short-term chart and fails to break through $117,000 on the daily timeframe, bearish momentum is likely to persist. A breakdown below $108,500 would confirm the continuation of the downtrend, with the next major support seen near the $105,000 level. 🐻💣
FAQ 🧭
- Where is bitcoin price heading next?
Bitcoin remains range-bound with bearish pressure until it reclaims $117,000 or breaks below $108,500. 🕳️💸 - What’s driving bitcoin’s current trend?
Heavy profit-taking, weak volume, and resistance at key levels are shaping the short-term downtrend. 🧠📉 - Is now a good time to buy bitcoin?
Technicals suggest caution, with confirmation needed above $117,000 for a bullish shift. 🧠💸 - What are bitcoin’s key support and resistance levels?
Immediate resistance lies at $117,000, with critical support near $108,500. 🕳️📉
Read More
- Off Campus Season 1 Soundtrack Guide
- DoorDash responds after customer uses AI to make food look bad and get a refund
- Euphoria Season 3’s New R-Rated Sydney Sweeney Scene Proves The Show Is Trolling Us
- Jon Bernthal Explains Why Marvel Let Him Make The Darkest Punisher Story Ever
- Gold Rate Forecast
- All Golden Ball Locations in Yakuza Kiwami 3 & Dark Ties
- Oh My God, It’s Her?
- Prime Video Has Officially Found The Next Game Of Thrones
- Law & Order Season 26: Release Date, Story, & Everything We Know
- YouTuber arrested after viral AI bodycam videos spark real police complaints
2025-10-14 17:09