Ah, Bitcoin, the interstellar hitchhiker of the financial universe, is currently hovering precariously above the $75,000 mark, as if deciding whether to grab a towel and continue its journey or crash-land into a sea of red candles. Selling pressure is mounting, and the market is frantically searching for structural support-because, let’s face it, no one wants to be the one who forgot to bring the scaffolding to this party.
Enter CryptoQuant’s MorenoDV, the galactic cartographer of Bitcoin flow data, who has spotted a signal so rare it makes the Heart of Gold’s Infinite Improbability Drive look like a bus schedule. The Bitcoin Fund Flow Ratio on Binance has waltzed back into the 0.010 to 0.012 zone for the sixth time since 2018. Yes, six times. That’s more repeats than the “So Long and Thanks for All the Fish” chorus at a Vogon poetry slam.
This isn’t just a metric hitting a random number; it’s a metric returning to a zone that has, on five previous occasions, acted as the financial equivalent of a “DO NOT PANIC” sign-though, let’s be honest, panicking is pretty much the default setting for crypto traders. The ratio measures BTC flowing through exchanges relative to the entire Bitcoin network, which is like comparing the number of people at a party to the number of people who actually brought snacks. When the ratio is high, exchanges are throwing a wild speculative bash. When it drops to this zone, the party’s over, and everyone’s gone home to nurse their hangovers.
So, what does this sixth visit mean? Well, MorenoDV isn’t handing out crystal balls, but they’re certainly pointing out that the last five times this happened, something interesting followed. It’s like the universe saying, “Here’s a signpost. You might want to pay attention, or you’ll end up in the Restaurant at the End of the Market.”
The Sixth Time’s the Charm? Or Just Another Cosmic Joke?
MorenoDV’s historical mapping of this ratio is like a treasure map, except instead of “X marks the spot,” it’s “0.010 to 0.012 marks the turning point.” This zone has shown up at pivotal moments in Bitcoin’s history, each time followed by a plot twist worthy of a Douglas Adams novel. Will the sixth time be different? Or will it just be the universe proving that it has a wicked sense of humor?

Take 2019, for example. After the 2018 bear market left Bitcoin trading near its cycle lows, the ratio compressed, signaling that sellers were as exhausted as a hitchhiker who’s been waiting for a lift for two years. What followed? A recovery that made 2019 look like a party on Magrathea. Then, in 2020, the ratio compressed again during the base-building phase, just before Bitcoin decided to go full rocket ship. The pattern is clear: compression precedes expansion, quiet precedes the move, and anyone who ignores history is doomed to sell at the bottom.
The current setup is asking the same question: Is this compression a sign of genuine apathy, or is it the calm before the next bull run? MorenoDV isn’t saying, but they’re definitely handing out popcorn for the show.
Bitcoin: Stuck Between a Rock and a Hard Place (Again)
Meanwhile, Bitcoin is consolidating near $77,000, like a traveler stuck between two interstellar customs checkpoints. Earlier this month, it tried to break above $80,000 but was promptly rejected-because, of course, resistance is always futiler than it seems. Now, it’s hovering above the $69,000 to $72,000 support zone, which has been highlighted more times than the “Don’t Panic” button on the Heart of Gold.
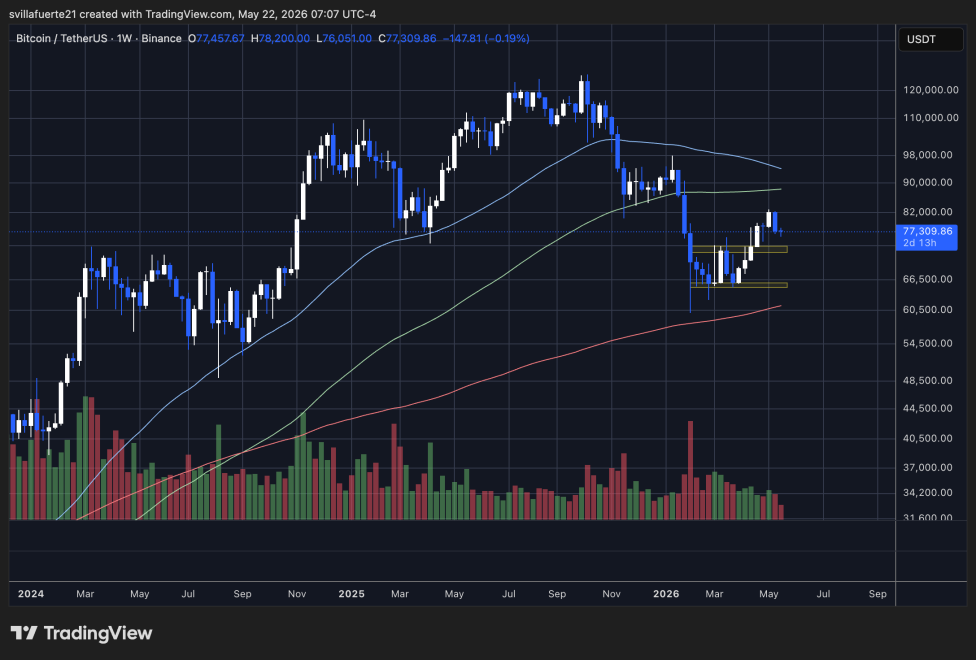
Technically, BTC is still below the 50-week moving average near $82,000, which is acting as dynamic resistance-the financial equivalent of a Vogon captain blocking your path. However, it’s trading above the 100-week and 200-week moving averages, so the long-term structure hasn’t completely collapsed. Yet.
The real drama is the compression between lower highs and defended support. Buyers keep stepping in around the highlighted zones, preventing a deeper retrace, but each rebound is weaker than the last. It’s like watching a space shuttle try to take off with only half its engines firing. Volume has also declined, suggesting that the recent rebound was more of a shrug than a roar.
For the bulls, reclaiming $82,000 and the 50-week moving average would be the first sign that the correction is losing its grip. Until then, Bitcoin remains in a consolidation phase where both continuation and breakdown are on the table-much like the menu at the Restaurant at the End of the Universe: full of options, but none of them particularly reassuring.
Read More
- Off Campus Season 1 Soundtrack Guide
- DoorDash responds after customer uses AI to make food look bad and get a refund
- Jon Bernthal Explains Why Marvel Let Him Make The Darkest Punisher Story Ever
- 10 Most Universally Beloved Sci-Fi Movie Villains, Ranked
- Ethereum Eyes Break Above $2,420 as Rally Hangs in the Balance
- All Golden Ball Locations in Yakuza Kiwami 3 & Dark Ties
- Gold Rate Forecast
- The Masterpiece World War II Movie ‘Saving Private Ryan’ is Streaming on Paramount+ in April 2026
- Umamusume has been transformed into a D&D game with new race
- The Strongest Battlegrounds codes (May 2026)
2026-05-23 07:17