Author: Denis Avetisyan
New research demonstrates how explainable AI techniques can improve the performance and trustworthiness of machine learning models used in critical industrial applications.
Integrating SHAP values and time-series decomposition into convolutional neural networks enhances anomaly detection in industrial Cyber-Physical Systems through increased model interpretability.
Despite the increasing reliance on machine learning within critical infrastructure, the inherent opacity of complex models poses significant challenges to ensuring reliable operation in industrial Cyber-Physical Systems. This work, ‘Explainable AI to Improve Machine Learning Reliability for Industrial Cyber-Physical Systems’, addresses this issue by leveraging Explainable AI (XAI) techniques-specifically SHAP values applied to time-series decomposition-to enhance the predictive performance of convolutional neural networks for anomaly detection. Our analysis reveals that incorporating contextual information through informed adjustments to model parameters, guided by XAI insights, can substantially improve performance. Could this approach unlock more robust and trustworthy AI solutions for increasingly complex industrial control systems?
The Imperative of Reliable Cyber-Physical System Monitoring
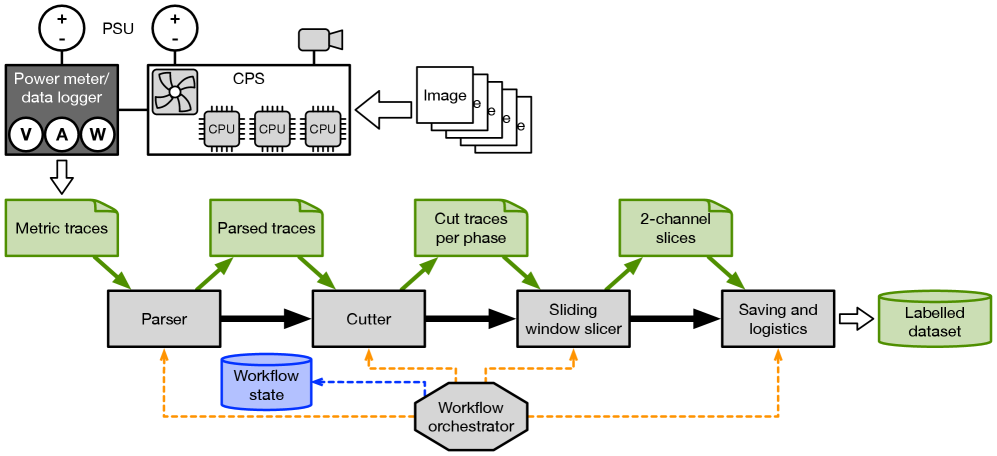
The escalating integration of cyber-physical systems into essential infrastructure – encompassing power grids, transportation networks, and manufacturing processes – necessitates increasingly sophisticated methods for monitoring and fault detection. These systems, where software algorithms are tightly coupled with physical processes, present unique challenges due to their complexity and potential for cascading failures. Unlike purely computational systems, failures in a CPS can have direct and significant physical consequences, demanding real-time responsiveness and proactive maintenance. Consequently, a robust and reliable monitoring framework isn’t merely a preventative measure; it’s a fundamental requirement for ensuring public safety, economic stability, and the continued operation of vital services. The demand for fault detection isn’t simply about identifying problems, but predicting them before they propagate into system-wide disruptions.
Cyber-physical systems generate vast streams of time-series data, often encompassing hundreds or even thousands of variables measured at high frequencies. Traditional statistical methods and machine learning algorithms frequently falter when applied to this data due to the ‘curse of dimensionality’ – as the number of variables increases, the data space expands exponentially, requiring exponentially more data to achieve reliable results. This poses a significant challenge for fault detection and performance monitoring, as subtle anomalies can be obscured within the noise and complexity of high-dimensional datasets. Furthermore, these conventional approaches often struggle to capture the intricate temporal dependencies and non-linear relationships inherent in CPS behavior, limiting their ability to accurately model system dynamics and predict potential failures. Consequently, researchers are actively exploring advanced techniques, such as dimensionality reduction, feature engineering, and specialized machine learning models, to effectively analyze and interpret the complex time-series data generated by these critical systems.
The pursuit of dependable cyber-physical systems necessitates a shift from merely identifying unusual events to comprehensively characterizing typical operational patterns. Traditional anomaly detection, while useful for flagging deviations, often lacks the nuance to differentiate between benign variations and genuine faults, leading to false alarms or missed critical issues. A robust approach demands techniques capable of learning the intricate relationships within time-series data – understanding not just what happens, but how and why. This involves modeling the system’s normal behavior with sufficient fidelity to predict expected states and accurately diagnose deviations, effectively building a ‘digital twin’ of the system’s functional characteristics. By focusing on a deeper understanding of operational behavior, engineers can proactively identify potential failures, optimize performance, and ultimately enhance the reliability of these increasingly vital infrastructures.
Deconstructing Time-Series Data for Systemic Insight
Time-series decomposition is a signal processing technique used to break down a complex time-series data stream into several interpretable components. These components typically include trend, seasonality, and residuals. The trend represents the long-term movement in the data, while seasonality captures repeating patterns over a fixed period. Residuals, also known as the remainder, represent the variation in the time series that is not explained by the trend or seasonality. Decomposition allows for focused analysis; for example, isolating the trend component can reveal underlying growth or decline, and examining residuals can highlight anomalous behavior or noise. Various methods exist for decomposition, including additive and multiplicative models, and the choice of method depends on the characteristics of the data and the relationships between the components. y(t) = T(t) + S(t) + R(t) represents an additive decomposition where y(t) is the original time series, T(t) is the trend, S(t) is the seasonality, and R(t) is the residual.
Low Frequency (LF) and High Frequency (HF) components, derived through time-series decomposition, provide distinct insights into signal behavior. LF components represent the underlying trend of the data, capturing gradual changes occurring over extended periods and indicating systemic shifts or long-term patterns. Conversely, HF components isolate rapid fluctuations and short-term variations, often representing noise, transient events, or immediate responses to stimuli. The amplitude of the HF component relative to the LF component can indicate signal stability; a high HF amplitude suggests greater volatility and potential anomalies, while a dominant LF component suggests a stronger, more consistent trend. Analyzing these components independently allows for focused investigation of specific signal characteristics and facilitates the identification of deviations from expected behavior.
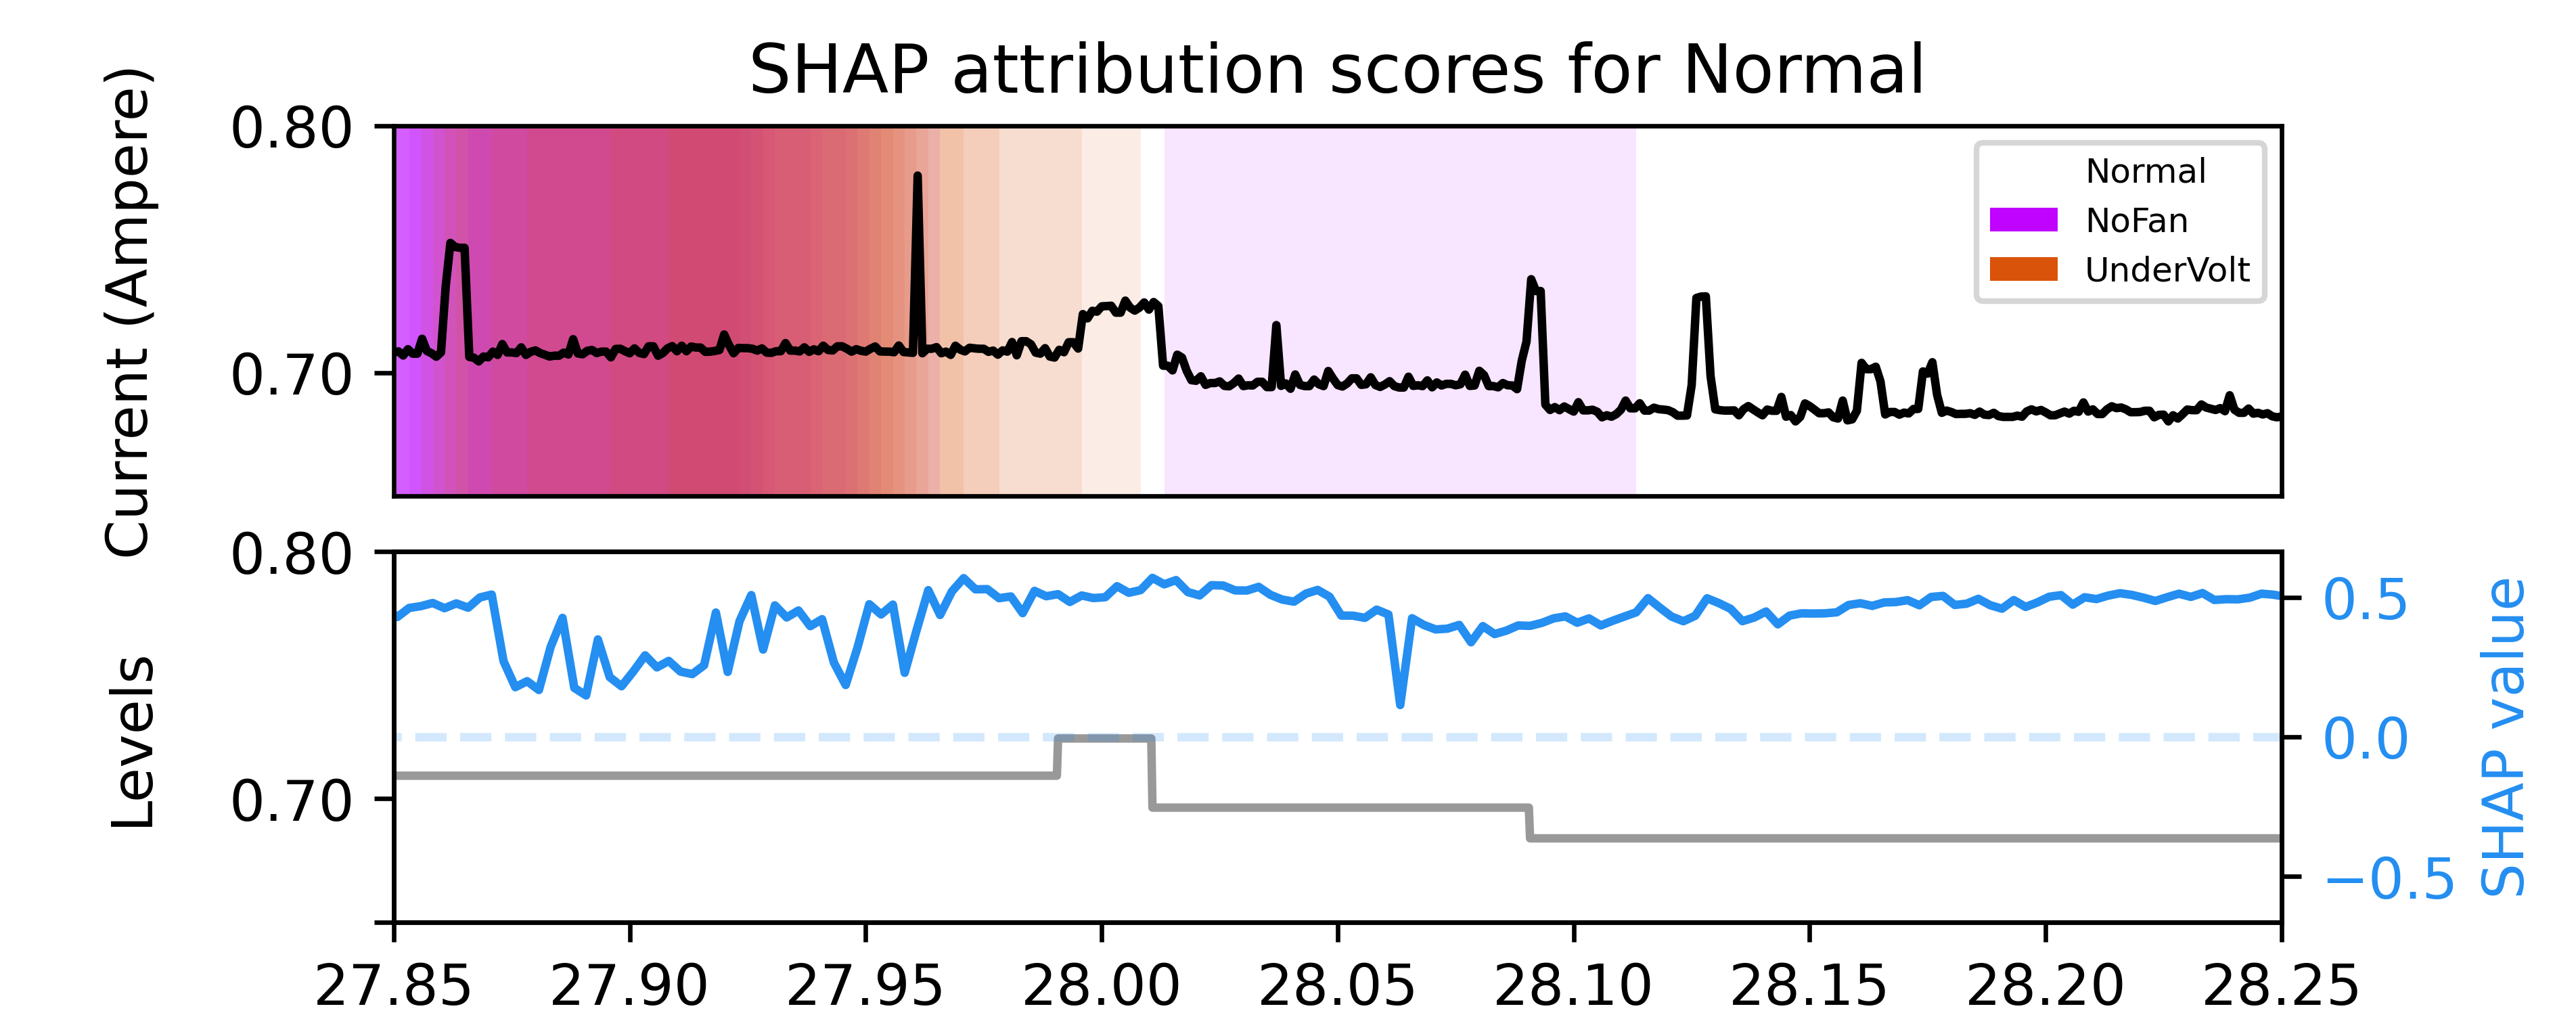
Data decomposition into Levels, Scale, and Peaks provides granular insight beyond basic trend and fluctuation analysis. Levels represent the baseline or average value of the time-series, indicating the typical operating range. Scale quantifies the magnitude of variations around this level, highlighting the overall volatility or amplitude of the signal – larger scale values suggest greater sensitivity to disturbances. Peaks identify specific, significant deviations from the baseline, either positive or negative, and can serve as indicators of transient events, faults, or critical process states. Analyzing these components in conjunction allows for precise anomaly detection; for example, a peak exceeding a defined threshold relative to the current level and scale can flag a potentially problematic condition, while sustained shifts in level may indicate a process drift requiring attention.
Interpreting time-series components – such as trends, seasonality, and residuals – within Industrial Control Systems (ICS) necessitates correlation with specific process variables and system states. Raw component identification is insufficient; analysis must consider the physical meaning of each component in relation to the monitored equipment or process. For example, a low-frequency component representing a rising trend in temperature data could indicate equipment degradation, while a high-frequency peak in vibration data might signal an immediate mechanical failure. Effective integration with ICS data structures, including process tags, equipment hierarchies, and alarm systems, enables contextualized anomaly detection and predictive maintenance strategies. Furthermore, understanding data lineage and the relationships between different time-series within the CPS is crucial for accurate interpretation and avoiding spurious correlations.
C-SHAP: Unlocking Model Transparency for Critical Systems
Machine learning techniques are increasingly vital for predictive maintenance and health monitoring within Cyber-Physical Systems (CPS) due to their capacity to analyze complex operational data. However, the inherent complexity of models such as Deep Neural Networks often results in a lack of transparency, making it difficult to understand why a particular prediction was made. This opaqueness hinders trust in the model’s output and limits the ability of engineers to confidently act upon its recommendations. While these models demonstrate strong predictive performance, the absence of interpretability poses a significant challenge for real-world deployment in critical infrastructure where understanding the reasoning behind decisions is paramount for safety and reliability.
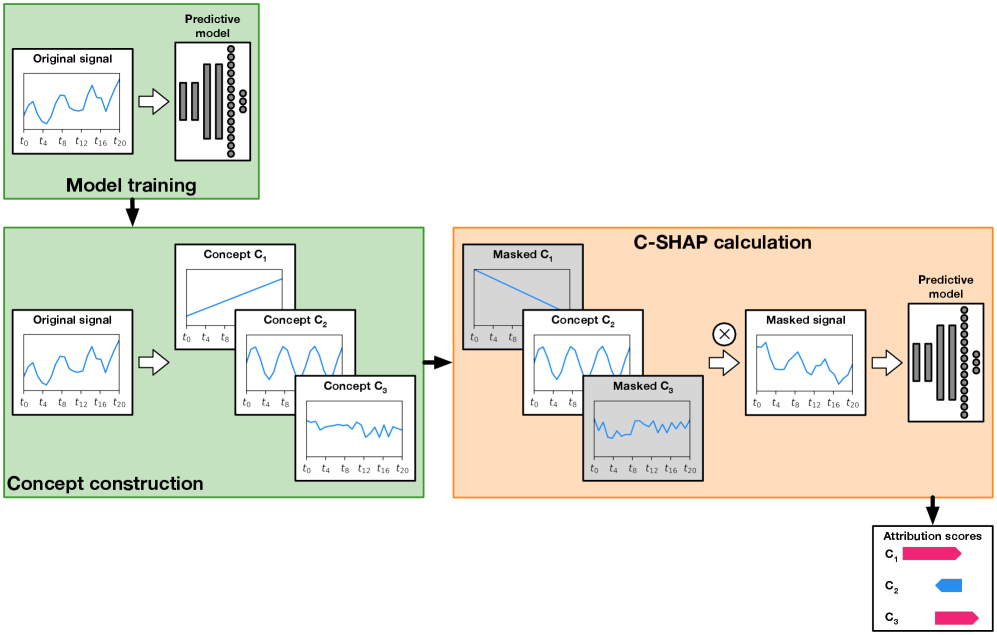
C-SHAP, or Convolutional SHAP, is a methodology used to decompose a prediction from a machine learning model into the contributions of individual time-series components. This allows for the assessment of each component’s influence on the overall predicted output, going beyond global feature importance to pinpoint specific drivers of model behavior. By calculating SHAP values for each time-series element within a defined window, C-SHAP provides a granular understanding of how changes in those components affect the prediction. This is achieved by considering all possible combinations of components and their impacts, effectively quantifying the contribution of each element in the context of the complete time-series data.
C-SHAP facilitates enhanced trust in machine learning models used in critical systems by providing granular explanations of predictive factors. This method moves beyond overall feature importance to reveal the specific contribution of each time-series component to individual predictions, enabling users to understand why a model arrived at a particular conclusion. This increased transparency supports more informed decision-making, allowing operators to validate model behavior, identify potential biases, and ultimately, confidently act on model outputs. In the context of CNN-based fault detection for industrial CPS, incorporating SHAP values into the model development process has demonstrated accuracy improvements of up to 92.3%, with increased window sizes (up to 400) correlating with both higher accuracy and improved consistency, as indicated by a decreasing standard deviation of Mean Absolute SHAP values (from 0.178 at a window size of 100 to 0.155 at a window size of 400).
Utilizing SHAP (SHapley Additive exPlanations) values moves beyond basic feature importance by quantifying the contribution of individual time-series components to model predictions, specifically within the context of system Execution Phases. Integrating these SHAP values into the training process of a CNN-based fault detection model for industrial Cyber-Physical Systems (CPS) has demonstrated significant accuracy improvements. Reported results indicate an accuracy of 83.78% with a time window of 100, 87.9% with a window of 200, and a peak accuracy of 92.3% when utilizing a window size of 400. This indicates that SHAP-informed model development not only enhances interpretability but also directly contributes to improved fault detection performance in industrial CPS applications.
The CNN-based fault detection model demonstrated a performance increase correlated with the size of the time-series window used for analysis. An accuracy of 83.78% was achieved utilizing a window size of 100 data points, which improved to 87.9% with a window size of 200. Peak performance was observed at a window size of 400, resulting in a maximum accuracy of 92.3%. These results indicate that incorporating a larger historical context, up to a window of 400 data points, enhances the model’s ability to accurately identify faults within the industrial CPS.
Analysis of Mean Absolute SHAP values, utilizing the Levels concept to assess feature consistency, indicates a correlation between window size and stability. With a window size of 100, the standard deviation of the Mean Absolute SHAP value is 0.178. This value decreases to 0.170 with a window size of 200, and further decreases to 0.155 with a window size of 400. This reduction in standard deviation demonstrates that larger window sizes, when used in conjunction with C-SHAP analysis, provide more consistent and reliable explanations of feature contributions to model predictions within the time-series data.
The pursuit of reliable anomaly detection, as demonstrated within industrial Cyber-Physical Systems, necessitates a commitment to provable, deterministic outcomes. Andrey Kolmogorov once stated, “The most important thing in science is not to know, but to know what we do not know.” This sentiment directly mirrors the approach detailed in the study; rather than accepting a ‘black box’ model that simply flags anomalies, the integration of SHAP values and time-series decomposition aims to illuminate the why behind the detection. This transparency isn’t merely about understanding; it’s about establishing a foundation for verifiable results, aligning with a fundamentally mathematical view of system correctness. The ability to dissect model reasoning, particularly through techniques like SHAP, allows for informed hyperparameter adjustments and builds confidence in the system’s reliability-a pursuit of demonstrable truth over empirical success.
What’s Next?
The pursuit of ‘explainability’ often feels like an attempt to attach narrative to fundamentally mathematical processes. This work, while demonstrating a pragmatic benefit in anomaly detection within industrial control systems, does not resolve the core tension. SHAP values, and time-series decomposition, are tools for post-hoc interpretation, not inherent properties of an ideal algorithm. The true elegance lies not in understanding why a CNN classifies a signal as anomalous, but in constructing a model where the classification itself is a direct consequence of provable system characteristics.
Future investigations should therefore move beyond merely illuminating ‘black boxes’. A more fruitful direction involves developing anomaly detection schemes grounded in formal verification. Could techniques from control theory – Lyapunov stability, reachability analysis – be integrated with neural network architectures to provide guarantees, rather than probabilities? The current emphasis on data-driven approaches, while yielding incremental improvements, risks obscuring the need for first principles.
Ultimately, the field must confront the fact that ‘explainability’ is often a human-centric concern, imposed upon systems designed for optimal performance. The question is not whether a model can be understood, but whether its outputs are consistently correct, irrespective of human comprehension. A perfectly opaque, yet perfectly reliable, anomaly detector remains the most desirable outcome.
Original article: https://arxiv.org/pdf/2601.16074.pdf
Contact the author: https://www.linkedin.com/in/avetisyan/
See also:
- Off Campus Season 1 Soundtrack Guide
- Chainsaw Man Volume 24’s Cover Art Reveals a Brand-New Denji
- X-Men ’97 Finally Gave Gambit the Hero Moment He Deserved
- 46 Years Later, The Mandalorian & Grogu Answers A Major Empire Strikes Back Question
- HoI4 fans harsh reactions to the announcement of another DLC pack
- 10 Worst End-Game Couples In Sitcom History
- Gold Rate Forecast
- DoorDash responds after customer uses AI to make food look bad and get a refund
- Emily Henry Says to ‘Trust the Vision’ For Beach Read Adaptation
- Hatsune Miku cosplayer goes viral selling $15 cups of “foot juice” to thirsty anime fans
2026-01-23 09:27