Author: Denis Avetisyan
A new approach dissects financial time series into distinct temporal components, revealing underlying dynamics and improving risk assessment.
This review details a method for timescale separation using generalized eigenvalue problems and time-independent component analysis to analyze parameter drift, mean reversion, and tail risk stability.
Financial time series present a paradox: seemingly continuous data often masks underlying processes operating at vastly different speeds. The paper ‘Fast Times, Slow Times: Timescale Separation in Financial Timeseries Data’ addresses this challenge by introducing a novel method for decomposing these series into components defined by their characteristic timescales, utilizing variance and tail stationarity criteria framed as generalized eigenvalue problems. This approach successfully isolates slow and fast dynamics in asset returns and prices, offering insights into phenomena like parameter drift, mean reversion, and tail risk. Could a more precise understanding of these timescales ultimately lead to more robust financial models and improved risk management strategies?
Unveiling the Rhythms of Finance: Timescale Separation as a Systemic Imperative
Conventional financial modeling frequently relies on the assumption of static relationships between market variables, a simplification that overlooks the reality of inherent multiscale processes. Markets are not characterized by uniform change; rather, they exhibit dynamics operating across a vast spectrum of timescales, from the millisecond actions of high-frequency traders to the years-long trends driven by macroeconomic factors. This oversight can lead to inaccurate predictions and flawed risk assessments, as models fail to account for how quickly changing variables influence slower, more persistent patterns. The assumption of static relationships effectively averages out these crucial temporal interactions, obscuring the complex interplay that governs asset behavior and potentially masking emerging instabilities within the financial system.
The complexity of financial markets, much like that of physical systems, arises from interactions occurring across vastly different timescales. Rapid trading activity, driven by sentiment and short-term news, often obscures the slower, more fundamental drivers of asset value – factors like economic growth, corporate earnings, and long-term interest rates. Consequently, analytical methods capable of separating these fast and slow dynamics are essential. These techniques, borrowed from fields like dynamical systems and signal processing, allow researchers to filter out high-frequency noise and reveal the underlying structural relationships governing market behavior. By disentangling these timescales, it becomes possible to identify leading indicators, improve forecasting accuracy, and ultimately, better understand the true forces shaping financial landscapes.
Accurate modeling of asset behavior hinges on recognizing that financial markets aren’t monolithic entities, but rather systems operating across a spectrum of timescales. Rapid fluctuations, driven by immediate news or order flow, often mask the slower, fundamental forces – such as macroeconomic trends or shifts in investor sentiment – that ultimately dictate long-term price movements. Failing to disentangle these dynamics introduces significant error into predictive models and risk assessments. Consequently, methodologies capable of separating fast-acting ‘noise’ from slow-evolving ‘signal’ are paramount for effective portfolio management and systemic risk mitigation; identifying these timescales allows for more robust forecasting and a clearer understanding of true market exposure, ultimately bolstering financial stability and enabling informed investment strategies.
Deconstructing Complexity: Introducing Time-Driven Independent Component Analysis
Time-driven Independent Component Analysis (tICA) is a statistical method used to decompose complex financial time series data into constituent components, each characterized by a distinct timescale of fluctuation. This decomposition is achieved by identifying statistically independent sources of variation within the data, effectively separating short-term, medium-term, and long-term dynamics. Unlike traditional methods which may prioritize variance explanation, tICA specifically aims to isolate components exhibiting minimal variance drift over time, thereby focusing on the underlying dynamic processes rather than simply capturing overall volatility. The resulting components can then be analyzed individually to understand the temporal behavior and interdependencies within the financial system, offering insights beyond those obtainable from analyzing the raw, aggregated time series.
The core of tICA involves formulating a Generalized Eigenvalue Problem to decompose a covariance matrix of time-delayed data. This problem seeks to identify components where the variance is minimized over time, indicating stable and persistent dynamics. Specifically, the method aims to find eigenvectors that satisfy \mathbf{C}_x \mathbf{v}_i = \lambda \mathbf{C}_y \mathbf{v}_i , where \mathbf{C}_x and \mathbf{C}_y are covariance matrices constructed from the time series data with varying time lags, and λ represents the eigenvalues. Eigenvectors associated with the smallest eigenvalues correspond to components with minimal variance drift, effectively isolating the dominant, slowly varying dynamics within the financial time series. The solution to this eigenvalue problem provides a set of uncorrelated components, each representing a distinct timescale of variation.
Variations of tICA beyond the initial linear implementation utilize nonlinear transformations to capture more complex temporal dependencies within financial time series data. While linear tICA assumes components evolve according to linear dynamics, nonlinear extensions, often employing kernel methods or neural networks, can identify components governed by nonlinear relationships. Comparative analysis demonstrates that these nonlinear tICA implementations can produce qualitatively distinct time series components compared to their linear counterparts, revealing dynamics not captured by linear approximations – specifically, nonlinear tICA may isolate components characterized by regime switching, asymmetry, or other non-linear behaviors, while linear tICA prioritizes components with minimal variance drift under linear assumptions.
Beyond Variance: Quantifying Stability Through Timescale Analysis
The analysis of variance timescales, as determined by the Covariance Matrix, offers a quantifiable assessment of asset return stability. This methodology decomposes asset return dynamics into components representing different temporal scales – short-term volatility, intermediate trends, and long-term behavior. The Covariance Matrix, a statistical tool measuring the relationships between asset returns at different points in time, is central to this decomposition. By performing an eigendecomposition of the Covariance Matrix, one can identify the principal components of asset return variation and their corresponding timescales. Larger eigenvalues indicate stronger, slower-varying components, contributing to overall stability, while smaller eigenvalues represent faster, more volatile fluctuations. Consequently, the resulting variance timescales provide a framework for understanding how persistent or transient asset return patterns are, allowing for a more nuanced evaluation of risk beyond simple volatility measures.
Analysis of asset return stability necessitates extending timescale analysis beyond variance to encompass extreme events, which are characterized by behavior in the tails of the return distribution. While variance-based timescales assess stability around the mean, they provide limited insight into the likelihood or magnitude of rare, impactful events. Focusing on higher moments, such as kurtosis and skewness, allows for the quantification of tail behavior; specifically, assessing the persistence or decay of these moments over time reveals whether tail characteristics are stable or prone to change. Instability in tail behavior indicates a heightened potential for unexpected, extreme outcomes and thus represents a critical component of tail risk assessment.
Fixed Point Iteration (FPI) serves as a crucial numerical technique when applied alongside time-independent component analysis (tICA) to determine the timescales governing extreme value behavior in asset returns. tICA decomposes the covariance matrix, and FPI refines this decomposition to isolate the components specifically related to tail risk. This iterative process involves repeatedly applying a transformation until convergence, effectively solving for the eigenvectors and eigenvalues associated with the slowest, most persistent modes of variation that drive large drawdowns or extreme positive returns. The resulting eigenvalues quantify the rate of decay of these tail timescales, while the corresponding eigenvectors define the directions in asset space most vulnerable to these extreme events, thereby revealing potential sources of Tail Risk not captured by traditional variance-based analyses.
Robustness Across Markets: Validating the Systemic Nature of Timescale Dynamics
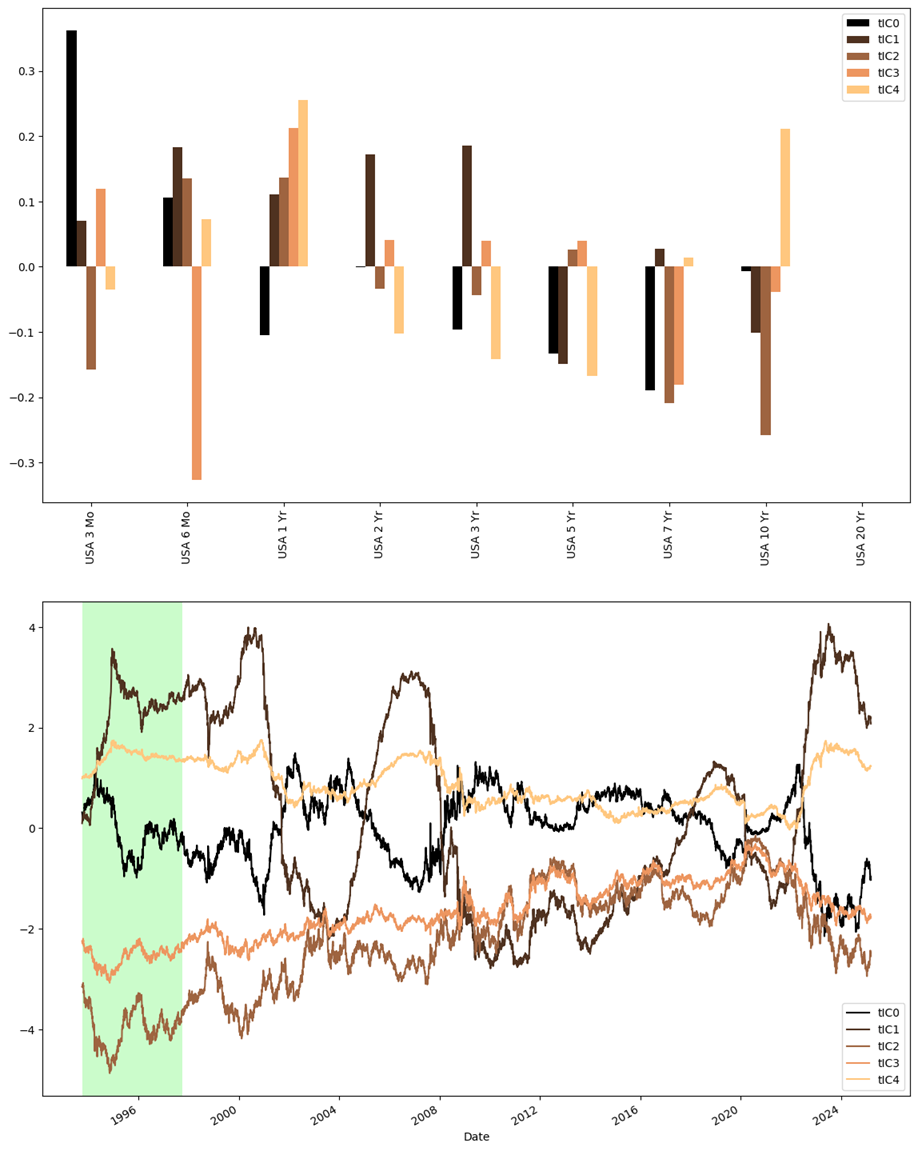
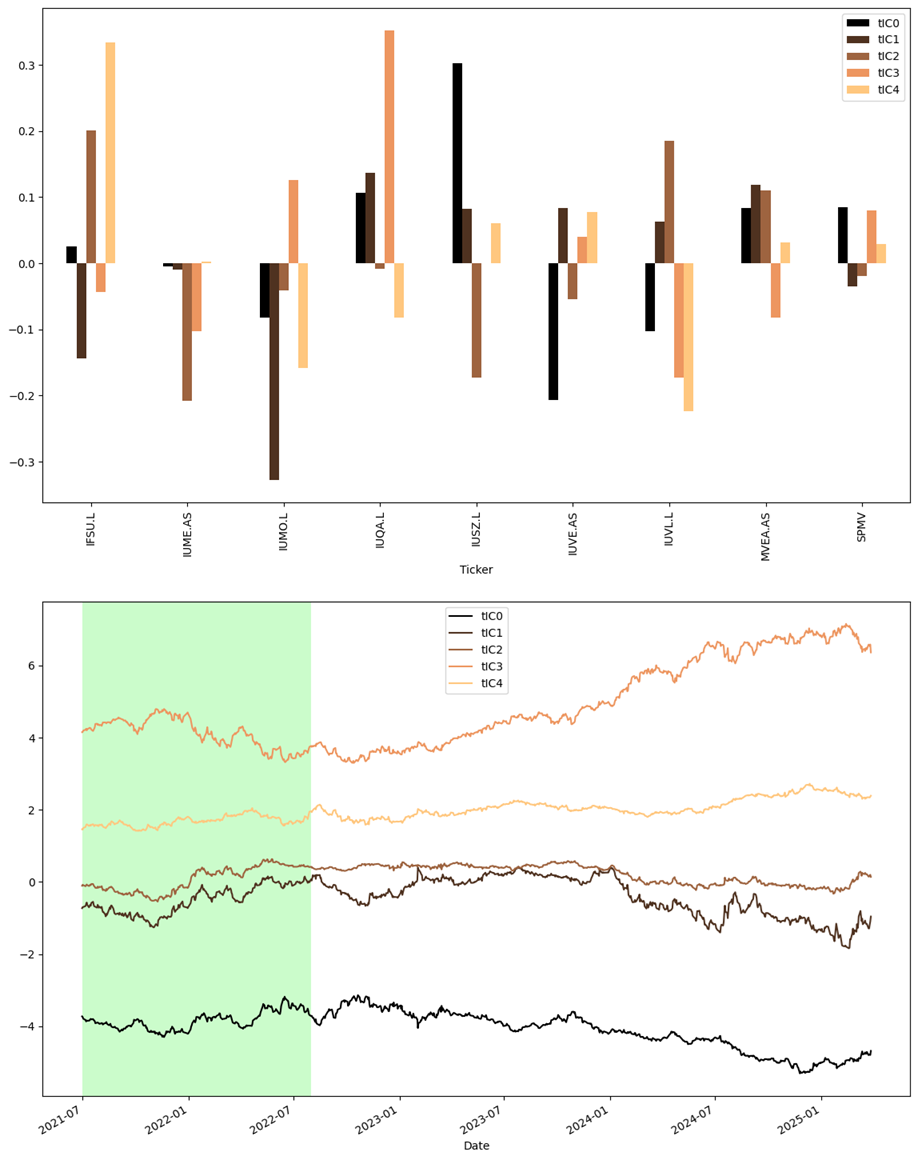
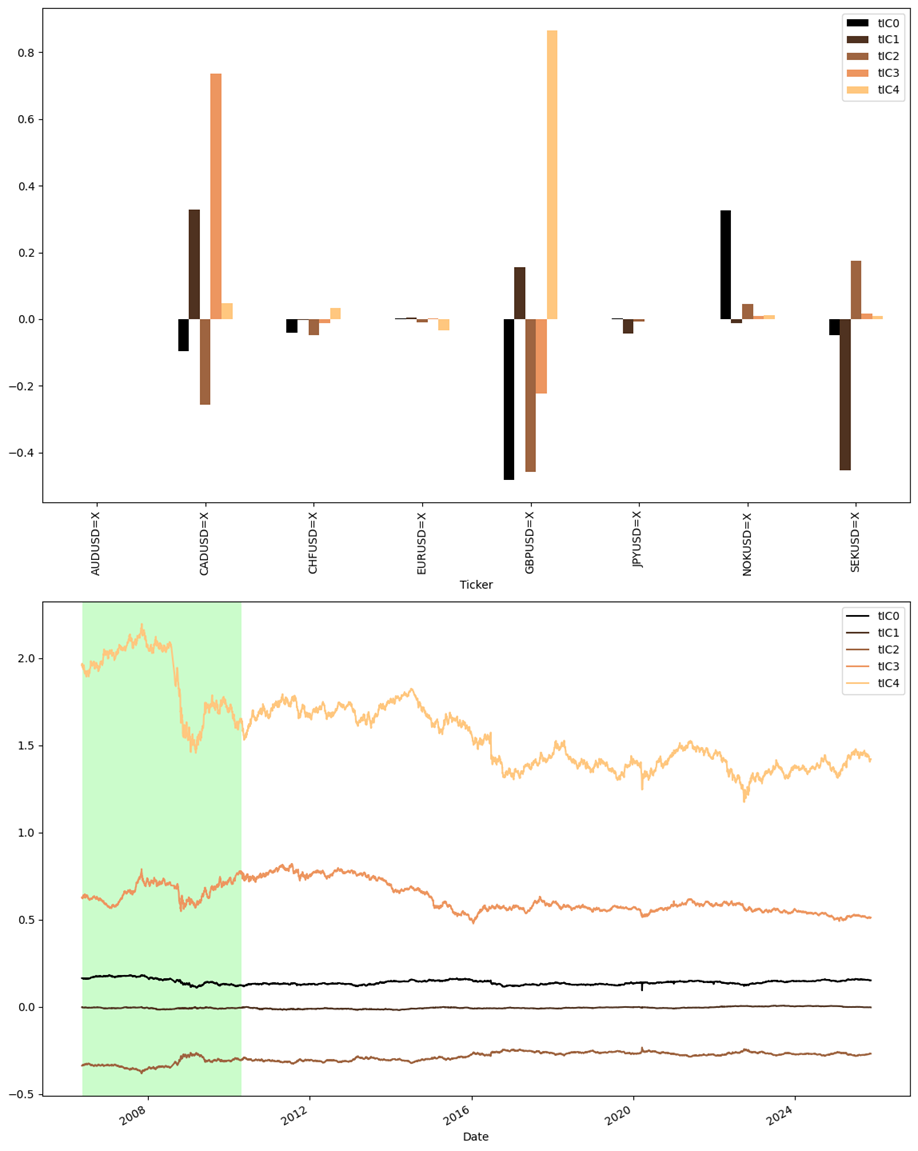
The application of time-lagged Independent Component Analysis (tICA) extends beyond single asset classes, proving its adaptability across varied financial landscapes. Analyses encompassing G10 currencies, US Treasuries, and Factor ETFs – utilizing data from 1994-2025 for Treasuries, 2006-2025 for currencies, and 2021-2025 for ETFs – demonstrate a consistent methodological framework applicable to diverse investment vehicles. This broad applicability highlights tICA’s potential as a unifying tool for analyzing complex financial systems, moving beyond bespoke models tailored to individual asset types and offering a more holistic view of market dynamics. The successful implementation across these distinct instruments suggests the identified underlying timescales aren’t merely statistical artifacts, but reflect genuine shared behaviors within the broader financial ecosystem.
Investigations across G10 currencies, US Treasuries, and factor-based ETFs reveal a surprising degree of synchronicity in their underlying temporal dynamics. This analysis demonstrates that despite differing asset characteristics and market sensitivities, these instruments exhibit consistent timescales governing their fluctuations – suggesting the presence of shared, systemic forces at work. The identified timescales, representing the speed at which these assets revert to their long-term means, are not unique to any single instrument but rather appear as a common feature across the entire spectrum of analyzed financial products. This points towards the existence of fundamental economic or investor behavioral patterns that influence price movements across diverse asset classes, implying that understanding these shared dynamics could provide valuable insights into broader market behavior and systemic risk.
The identified temporal patterns within these diverse asset classes demonstrate a striking resilience over time. Analyses reveal that the intrinsic timescales, established using in-sample data, do not visibly degrade when applied to previously unseen out-of-sample periods. This persistence suggests the presence of deeply rooted, underlying dynamics governing asset behavior. Importantly, even significant economic and geopolitical events – such as the 2008-2010 financial crisis and the 2023 geopolitical shifts – do not permanently alter these timescales; instead, the system components exhibit a capacity to revert to their original, slow-moving characteristics, indicating a remarkable degree of stability and self-correction within the financial landscape.
The pursuit of disentangling complex financial time series, as demonstrated in this work, echoes a fundamental principle of system design: understanding the whole is paramount. If a system survives on duct tape – a patchwork of assumptions and quick fixes – it’s likely overengineered, obscuring the underlying dynamics. This paper’s approach to timescale separation, revealing persistent patterns of parameter drift and mean reversion, suggests a move away from such brittle constructions. As Epicurus observed, “It is not the pursuit of pleasure itself that is bad, but the errors we make in pursuing it.” Similarly, it isn’t complexity that is inherently problematic, but rather a failure to identify and isolate the core, enduring components that truly drive behavior.
Looking Ahead
The persistent timescales identified in this work suggest a deeper, underlying structure governs financial time series than is typically acknowledged. Yet, the very act of separating these timescales carries an inherent irony. A system’s resilience arises not from isolating components, but from the interactions between them. Future efforts should focus less on dissection, and more on understanding how these distinct temporal rhythms coalesce to produce observed behavior – and crucially, how perturbations to one timescale propagate through the entire structure.
A particularly intriguing avenue lies in exploring the stability of these identified timescales themselves. While demonstrated to be remarkably persistent, all structures eventually degrade. What mechanisms govern the evolution of these temporal signatures? Are there detectable precursors to shifts in these underlying rhythms, and could these be leveraged to improve forecasting, or perhaps simply to understand the inherent limitations of prediction in complex systems?
Ultimately, this work highlights a fundamental tension. The desire for elegant, simplified models clashes with the messy reality of interconnectedness. Perhaps the most fruitful path forward lies not in seeking the ‘correct’ timescale separation, but in developing frameworks that explicitly acknowledge the fluidity and interdependence of these temporal components, embracing the system’s inherent dynamism rather than attempting to impose static order.
Original article: https://arxiv.org/pdf/2601.11201.pdf
Contact the author: https://www.linkedin.com/in/avetisyan/
See also:
- Gold Rate Forecast
- What is Omoggle? The AI face-rating platform taking over Twitch
- Scientology speedrun trend escalates as viewers map out Hollywood facility
- Japanese Coast Guard rescue a “lone flamingo” that was lost at sea
- Man pulls car with his manhood while on fire to raise awareness for prostate cancer
- INJ/USD
- Beyond Traditional Risk Metrics: Forecasting Market Volatility with Bayesian Networks
- Detonate codes (December 2025)
- Wartales Curse of Rigel DLC Guide – Best Tips, POIs & More
- How To Grow Money Trees In Animal Crossing: New Horizons
2026-01-19 12:43